
New Zealand Rental Vehicle Market Insights Report: October 2019
MarginFuel’s report summarizes the Average Market Rate of the New Zealand Rental Car Market for October 2019, showing key vehicle categories and locations.
October 2019
12th Edition | Issued 1st November 2019
- Section 1 - october 2019 Analysis
- Section 2 - Year to Date (YTD) Analysis
- Section 3 Forward Market Analysis
- Methodology & Disclaimer
SECTION 1
OCTOBER 2019 ANALYSIS
Year on Year (YoY^) Average Rate Change
- For all three locations, across all sales channels, the average rate was lower YoY
- The average rate for Auckland Airport (AKL) -10% lower versus prior year
- Christchurch Airport (CHC) average rate was -3% YoY
- Queenstown Airport (ZQN) average rate was -1% YoY
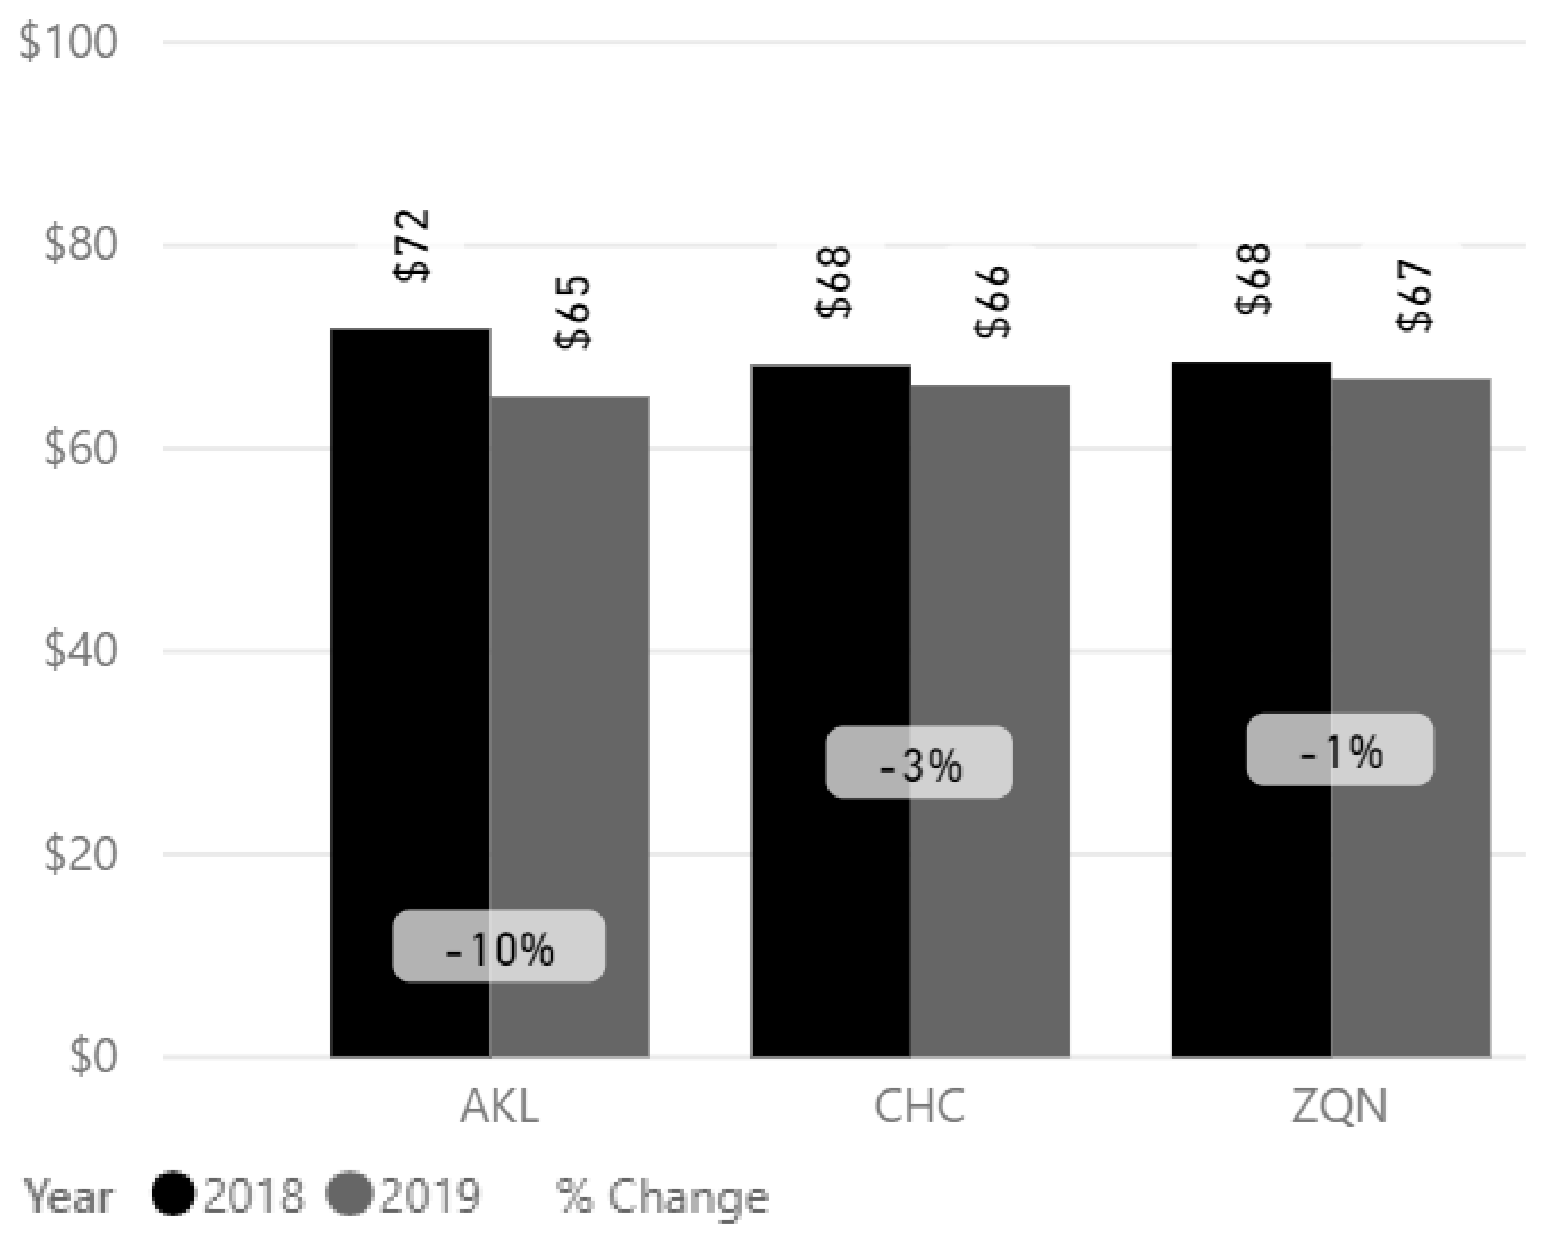
Fig. 1
Channel, Duration and Vehicle Category
Refer to sales channels (Fig.2), duration (Fig.3) and vehicle category (Fig.4) graphs for the average rates during the month. As was the trend in prior months, the average rates for the shorter 3-day duration remains strong.
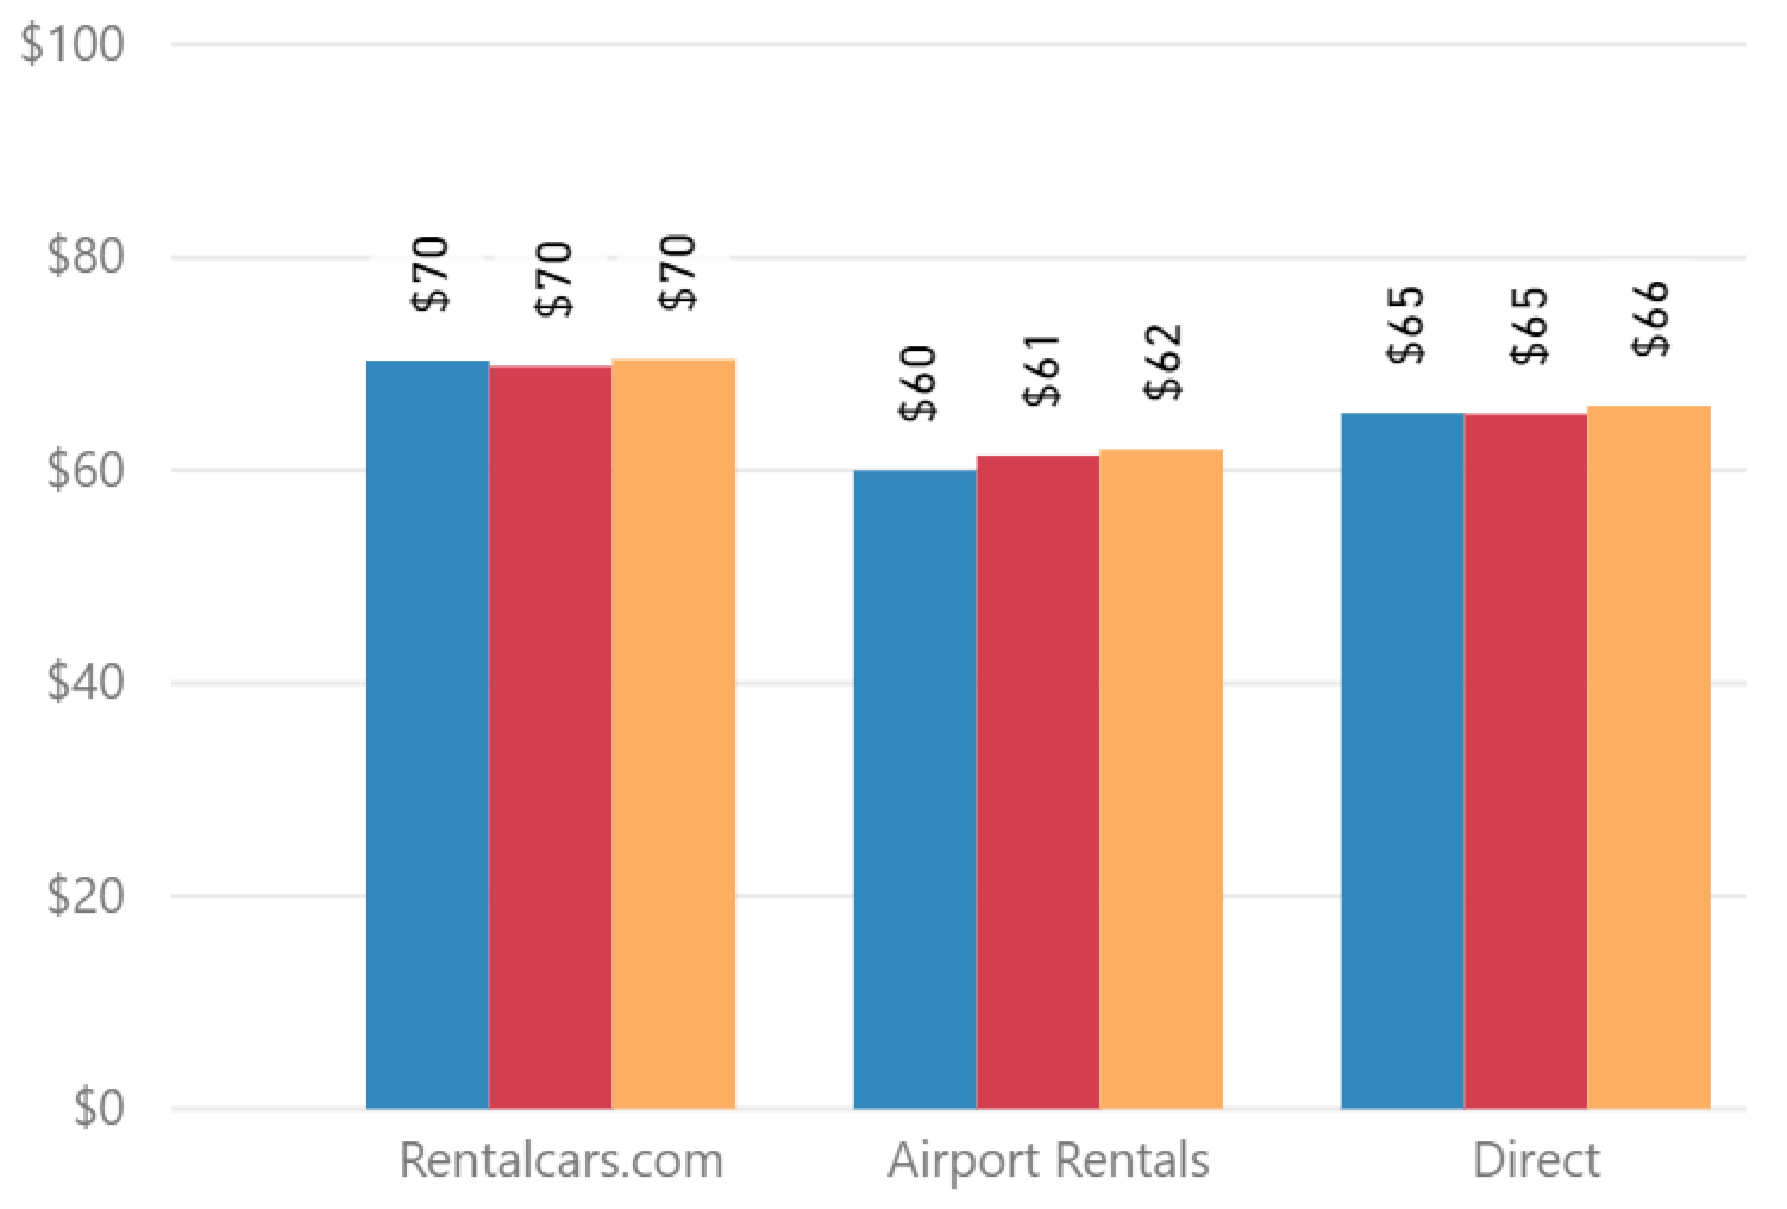
Fig. 2
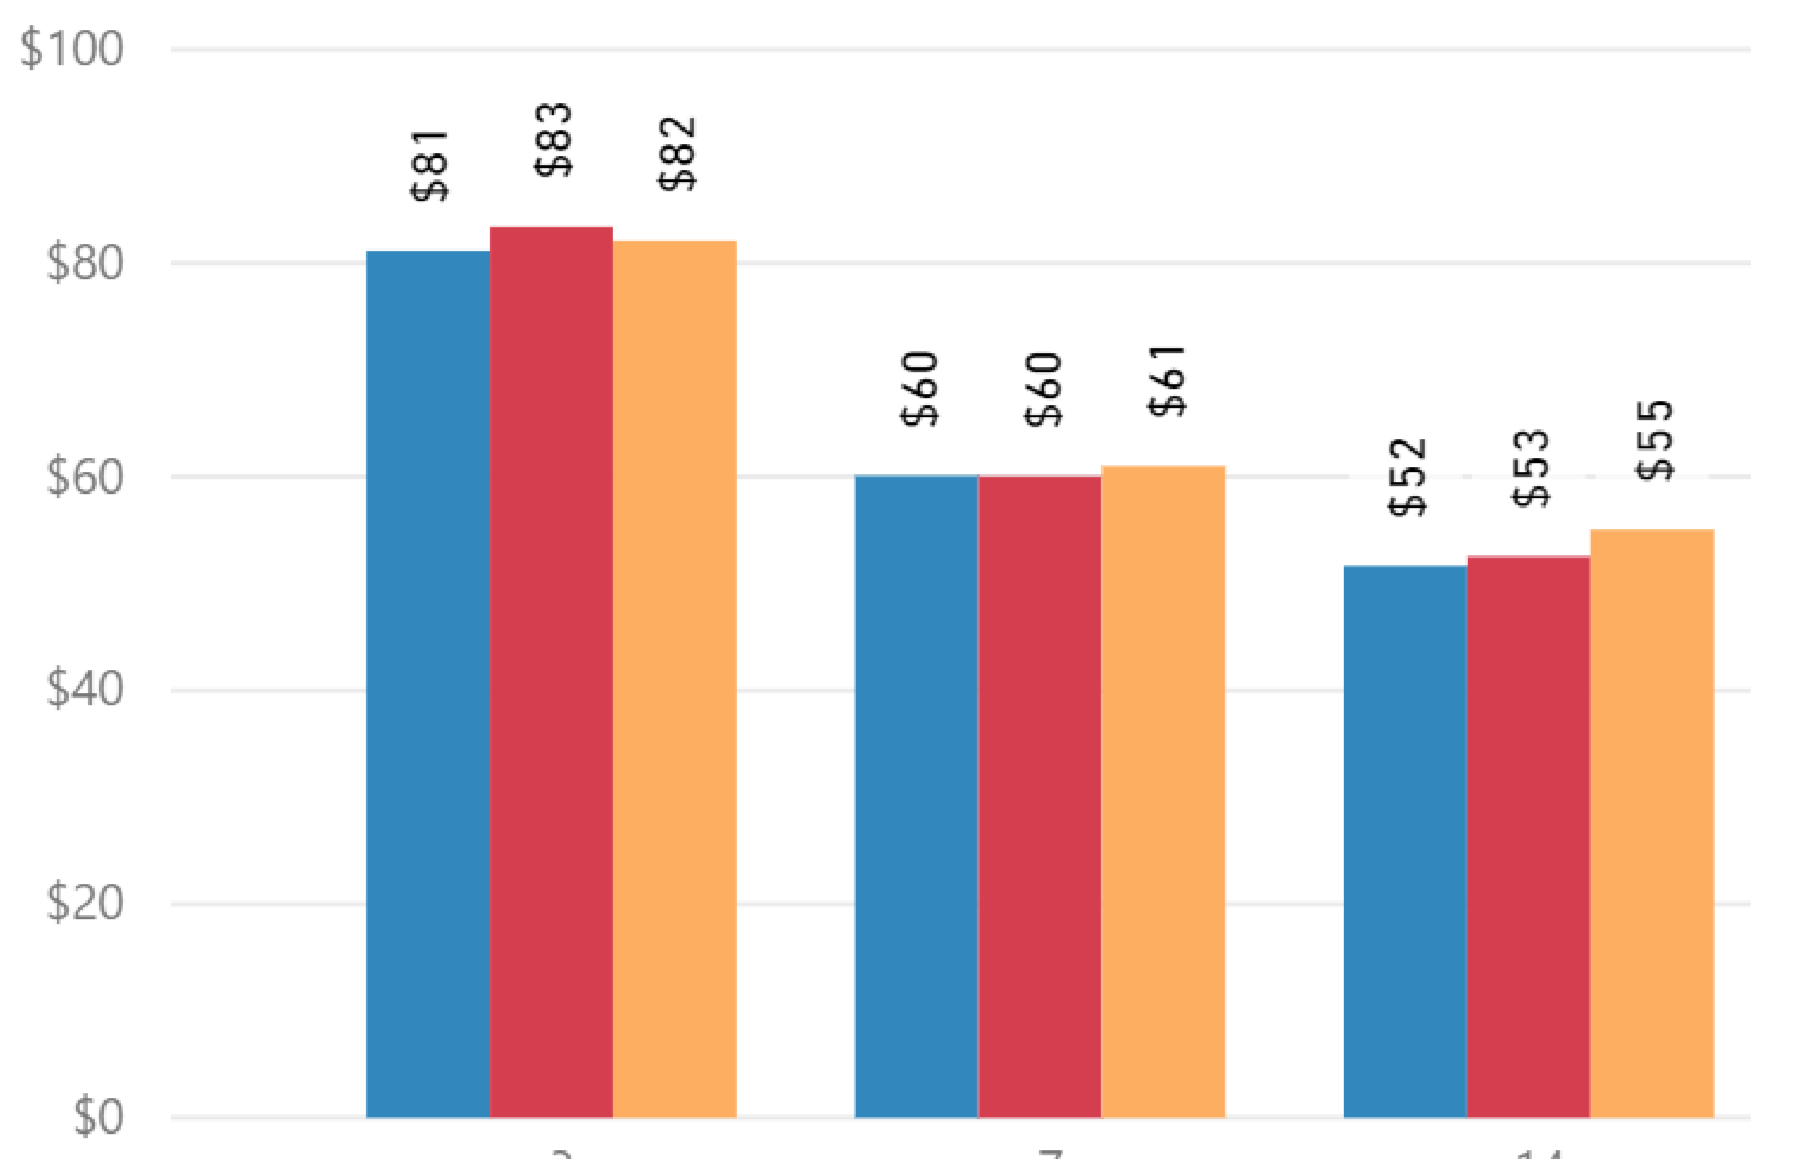
Fig. 3
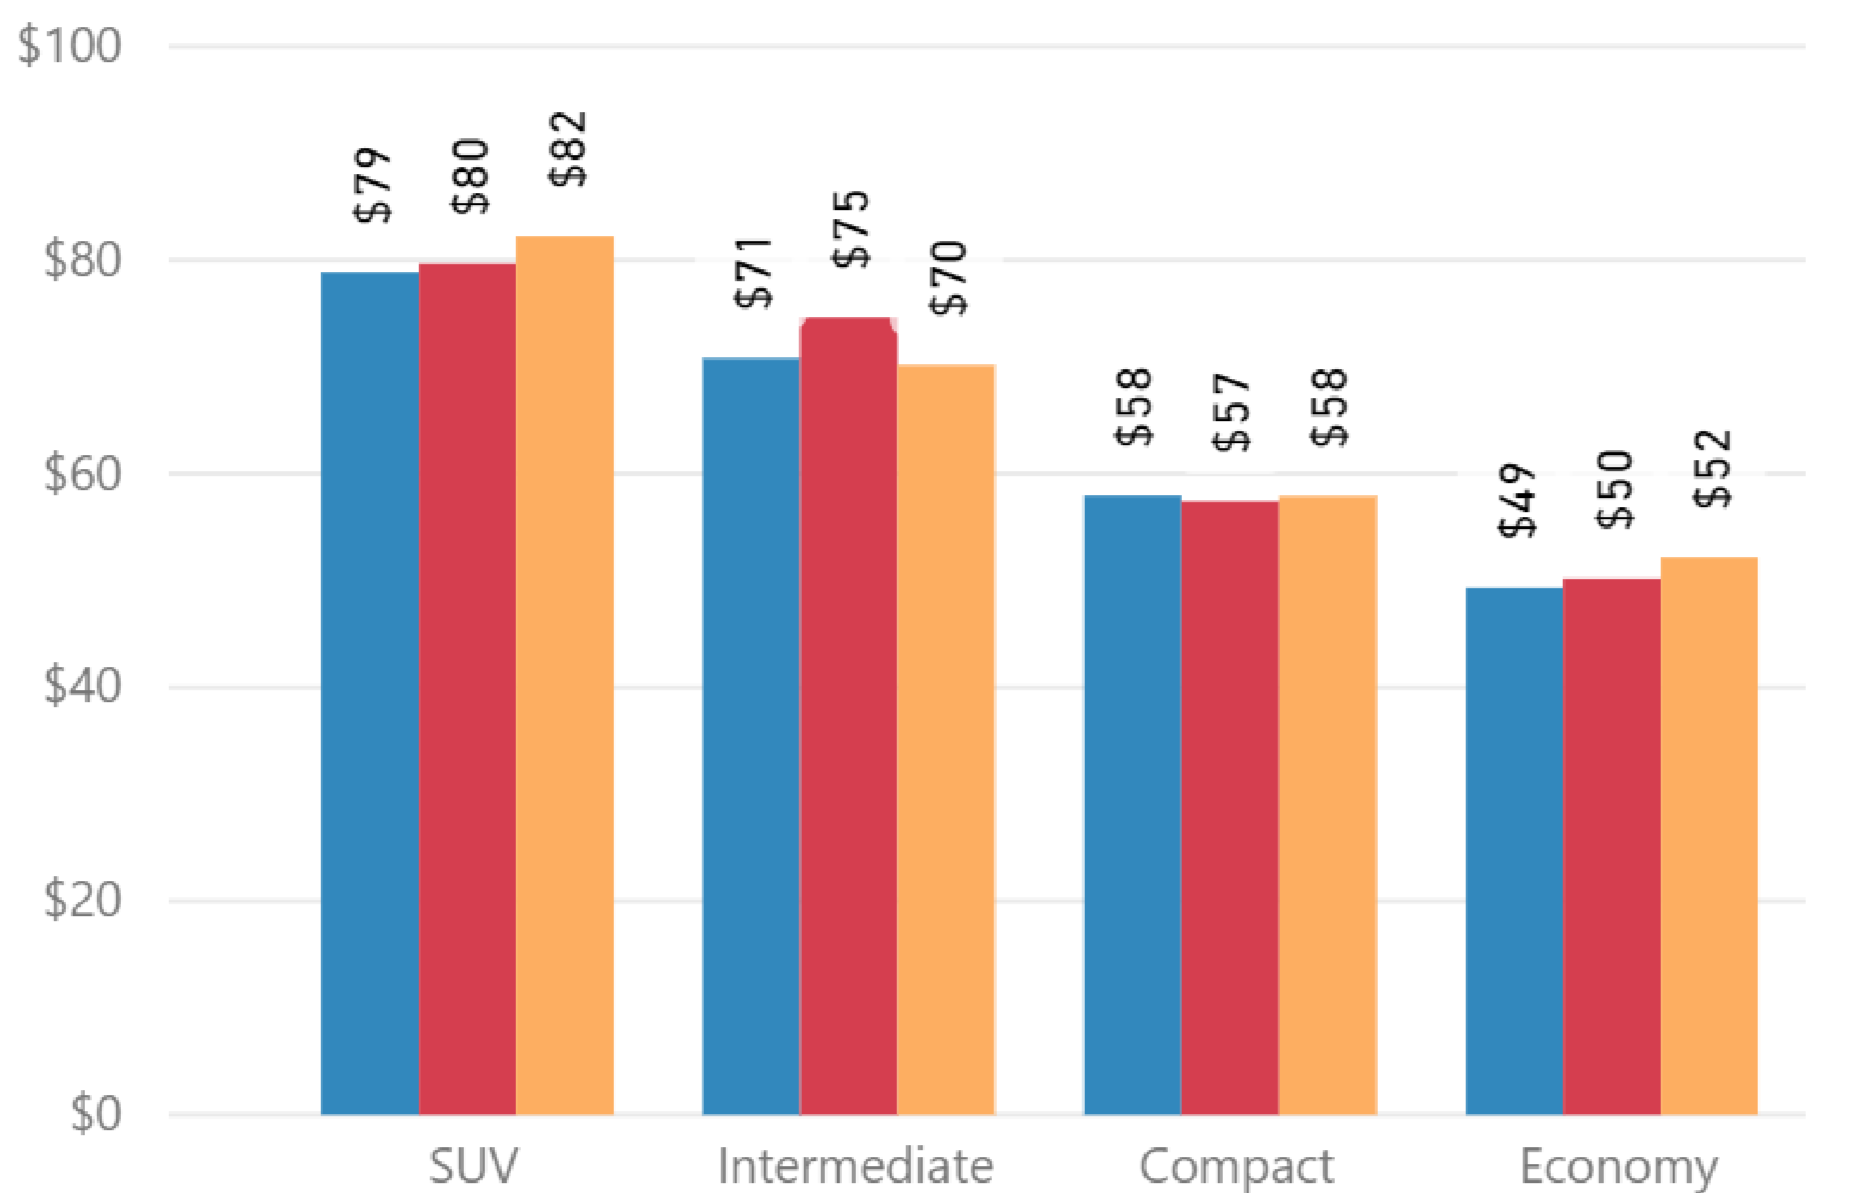
Fig. 4

Auckland Airport YoY Summary
Overall Auckland Airport had a YoY average rate decrease of -10%.
Rentalcars.com sales channel average rate was flat, while Airport Rentals and the direct channels showed decreases of -17% and -13% respectively (Fig. 5).
The average rate for 3-day duration decreased -4%, while the average rate for longer 7-day was -10%, and 14-day duration -17% (Fig. 6).
The average rate for SUV’s in Auckland was -11% YoY, with all other categories showing average rates of between +2% and -8% (Fig. 7).
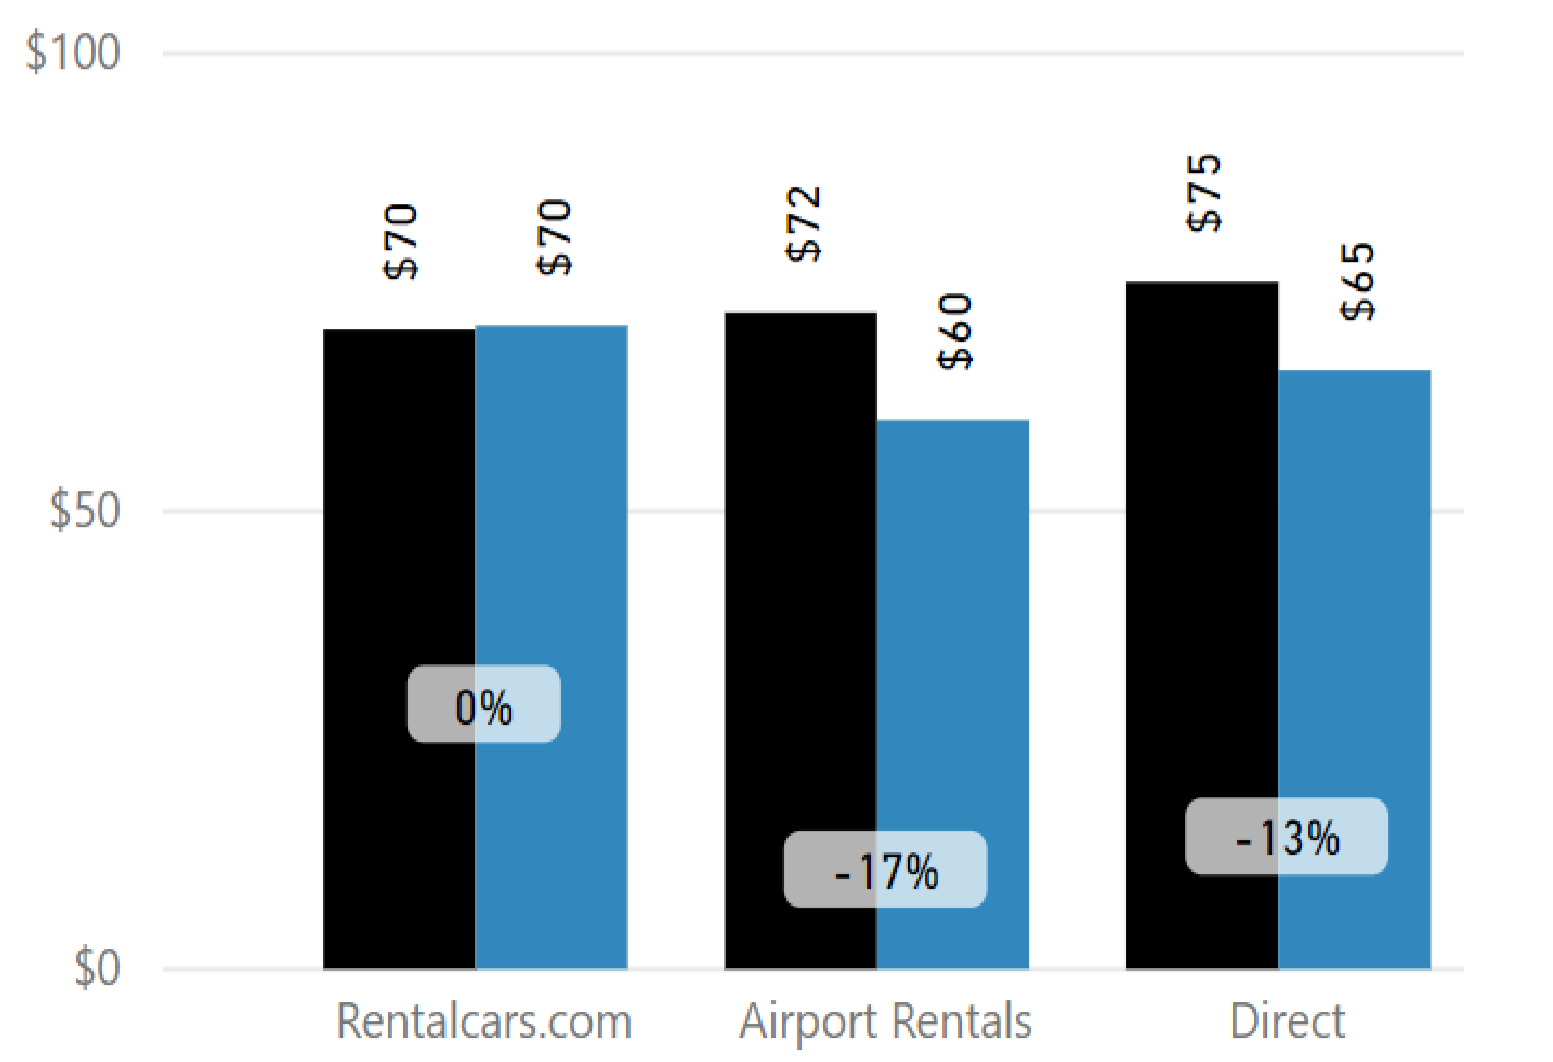
Fig. 5
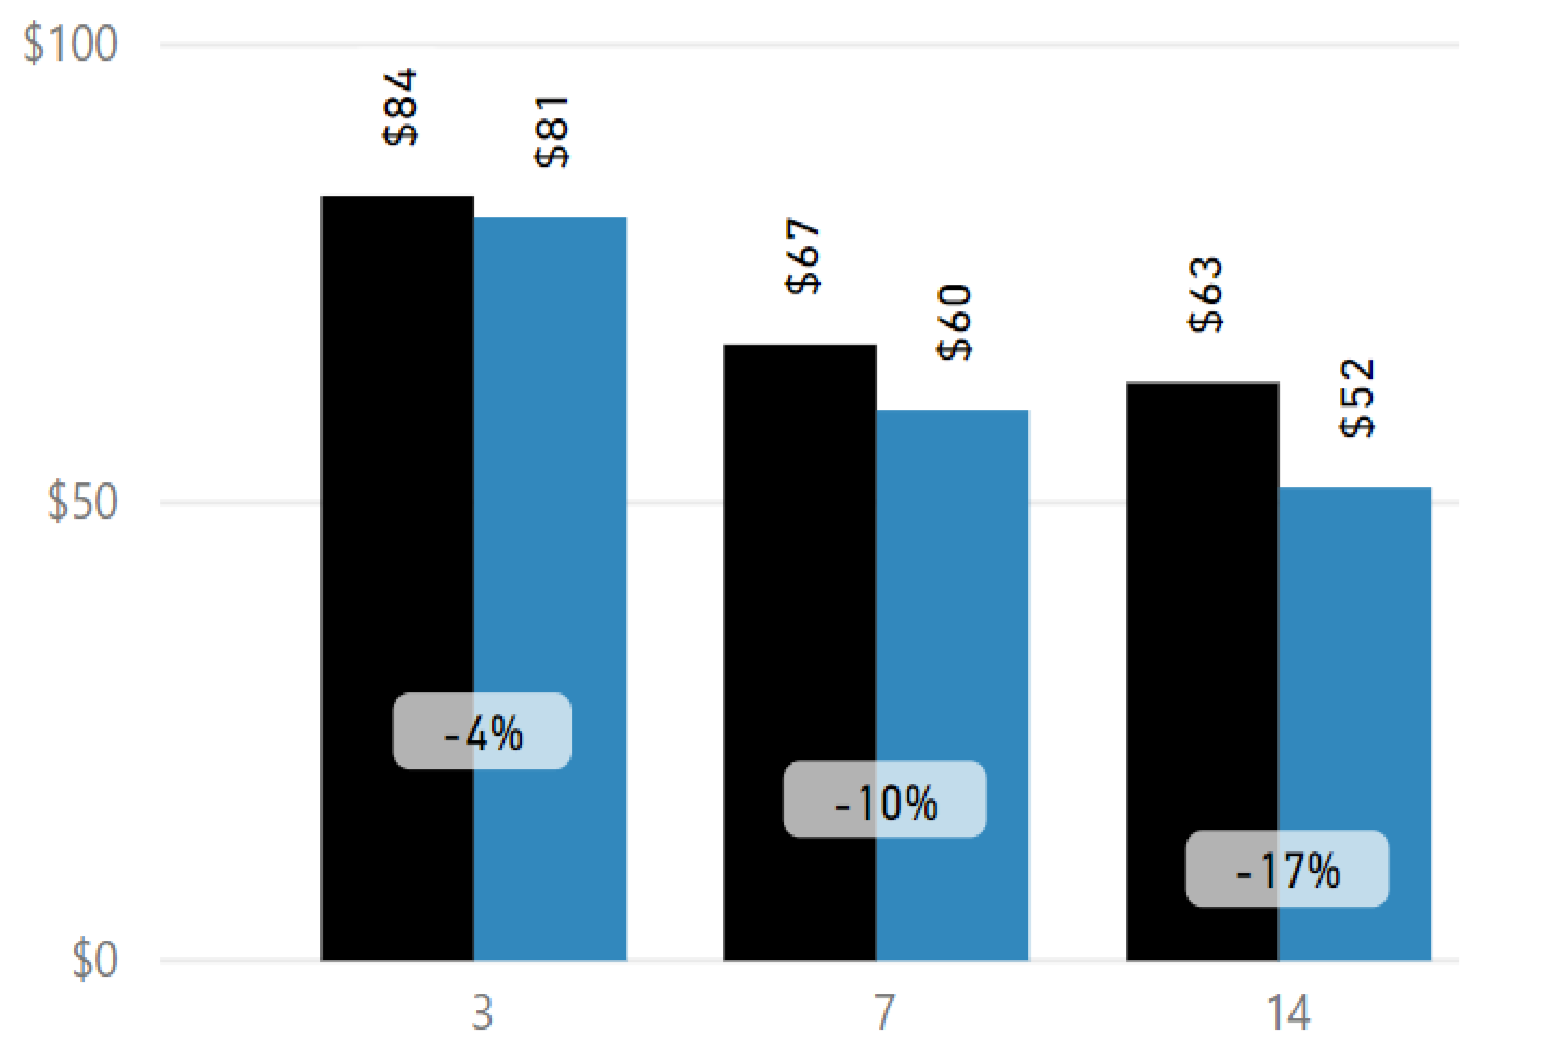
Fig. 6
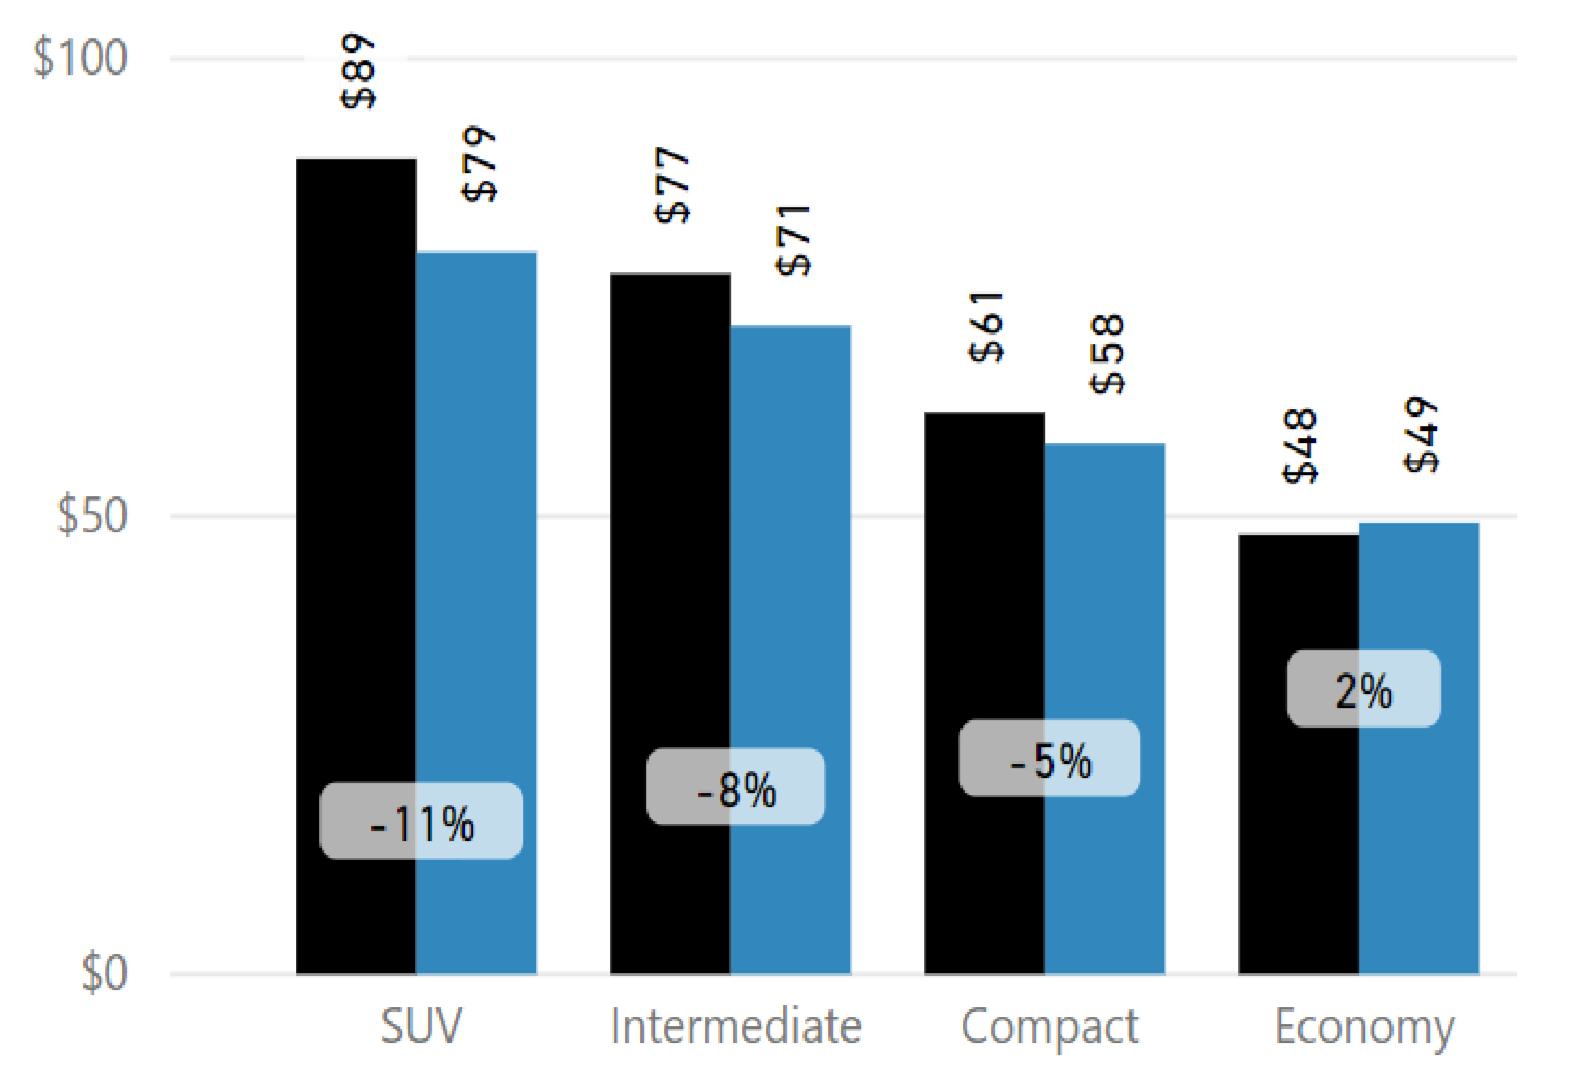
Fig. 7

Christchurch Airport YoY Summary
Overall Christchurch Airport had a YoY average rate decrease of -3%.
Rentalcars.com sales channel showed an average rate increase of +3%, while Airport Rentals and the direct channels showed decreases of -12% and -4% respectively (Fig. 8).
The average rate for 3-day durations increased +2%, while the average rate for longer 7-day and 14-day durations were lower by -5% and -10% respectively (Fig. 9).
The average rate for SUV’s was down -4%, with all other categories showing average rates of between +1% and -8% (Fig. 10).
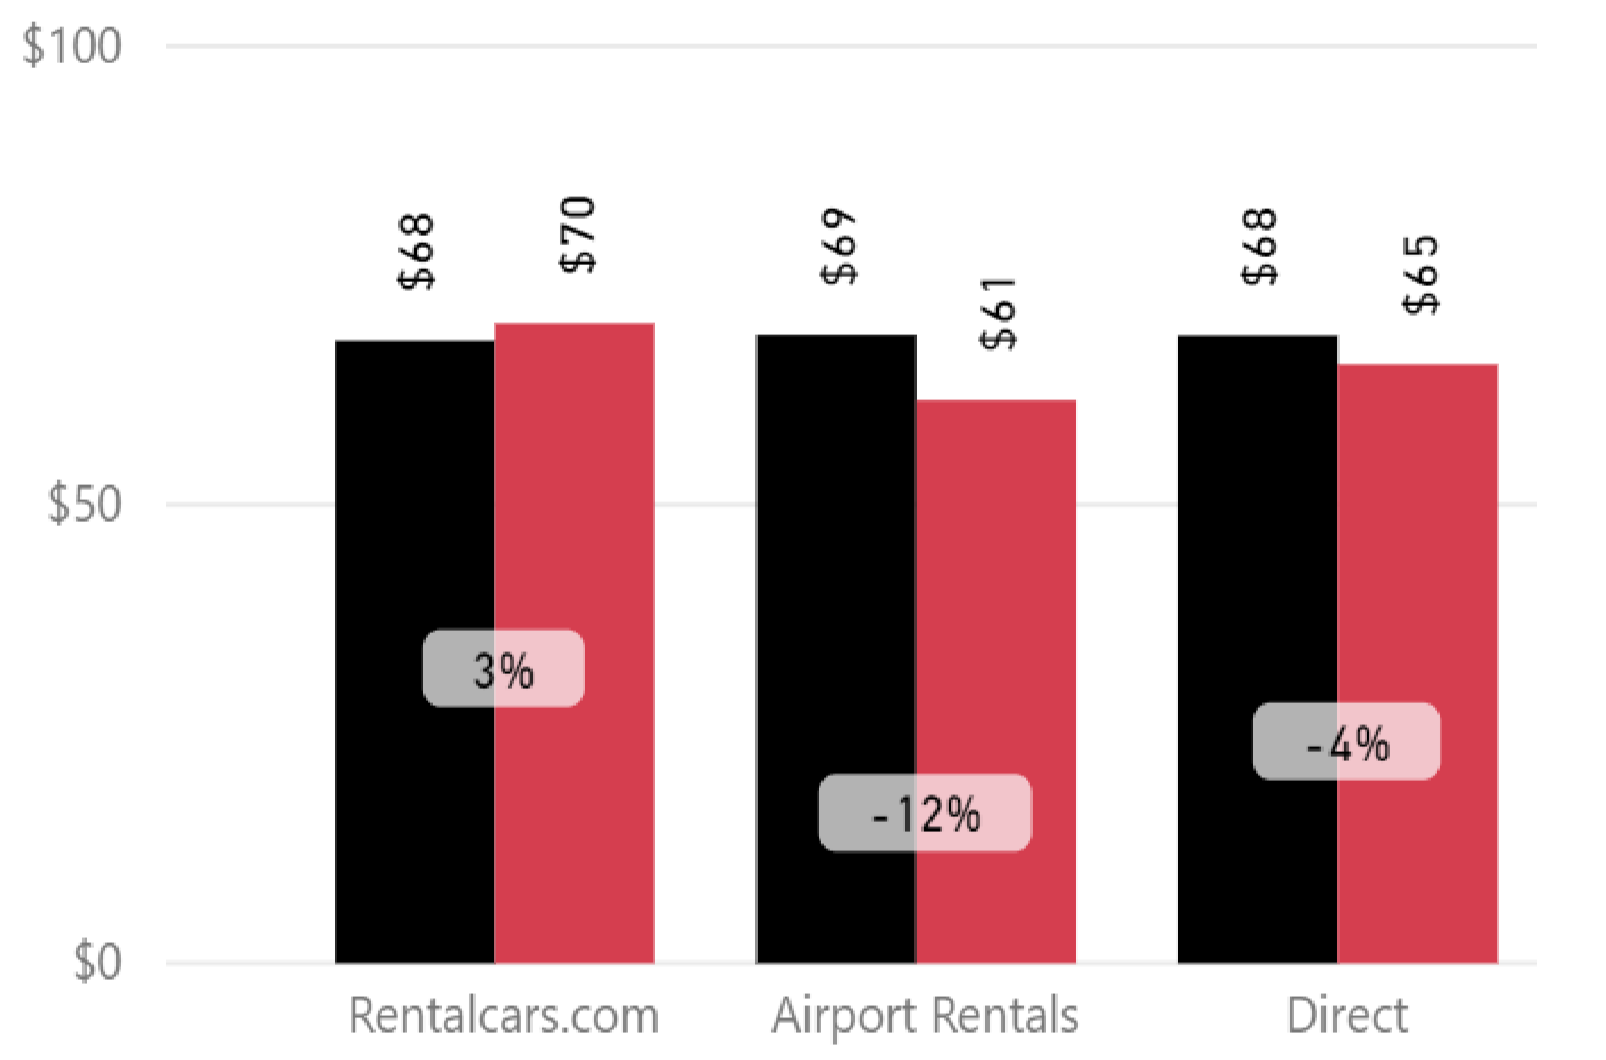
Fig. 8
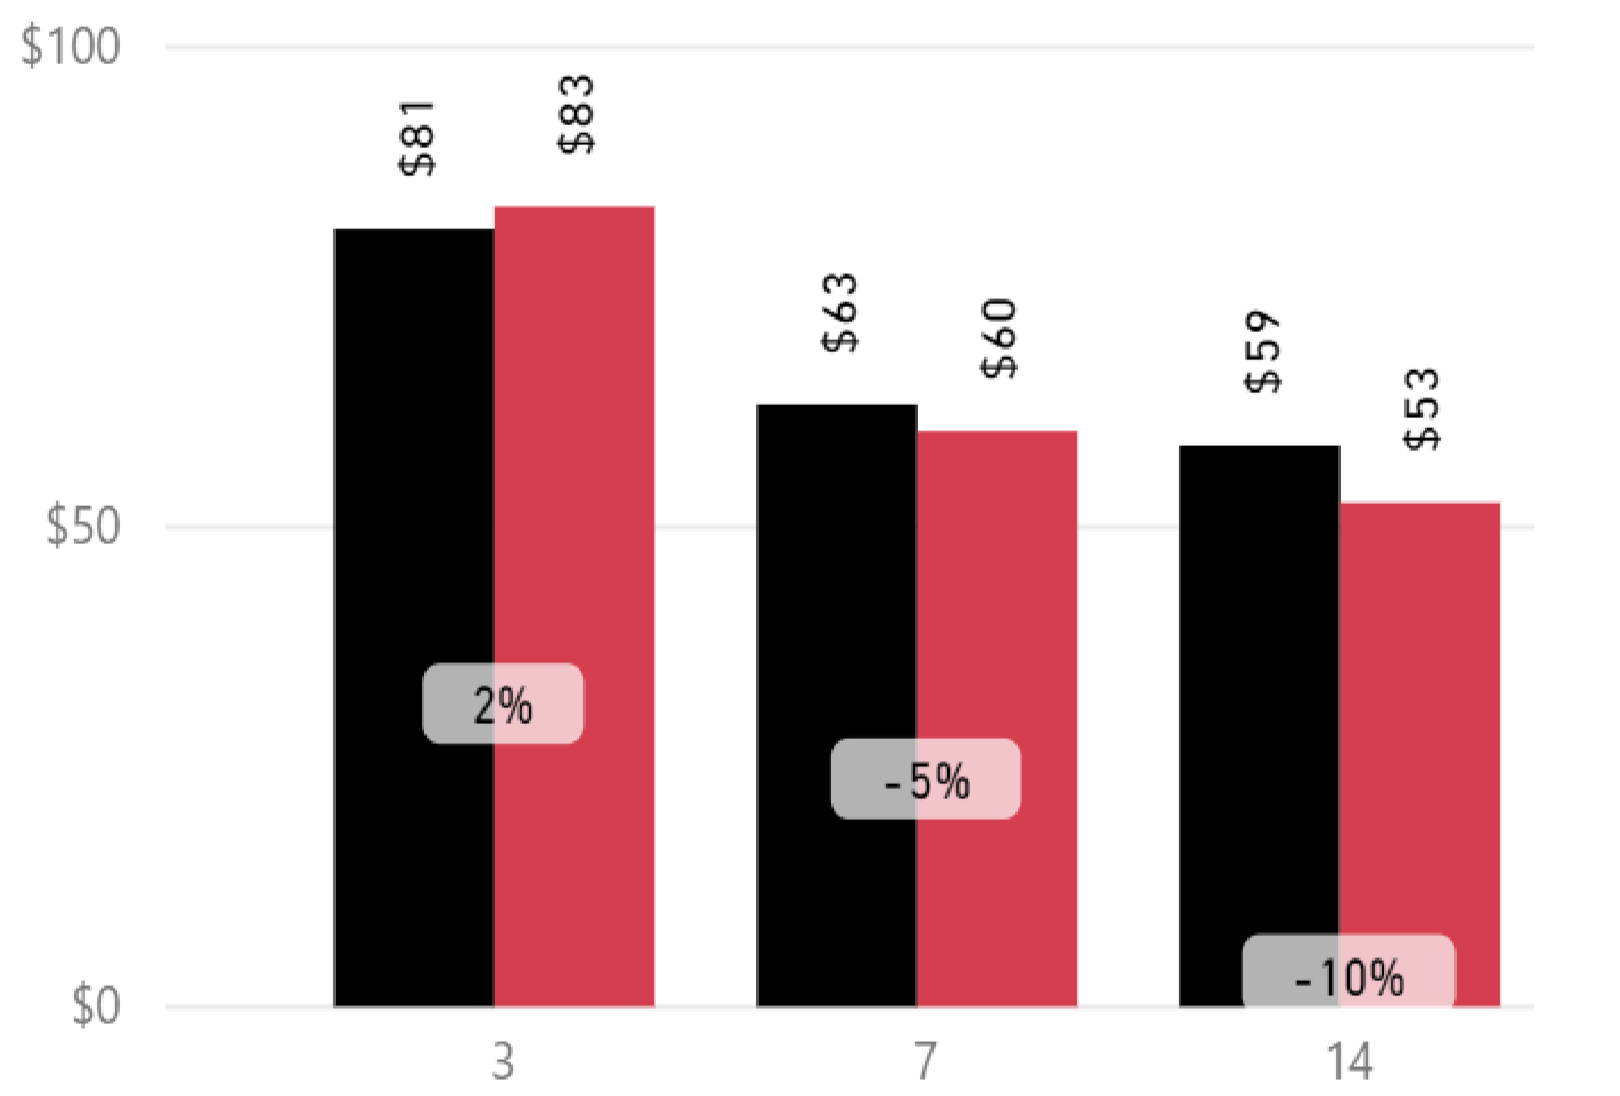
Fig. 9
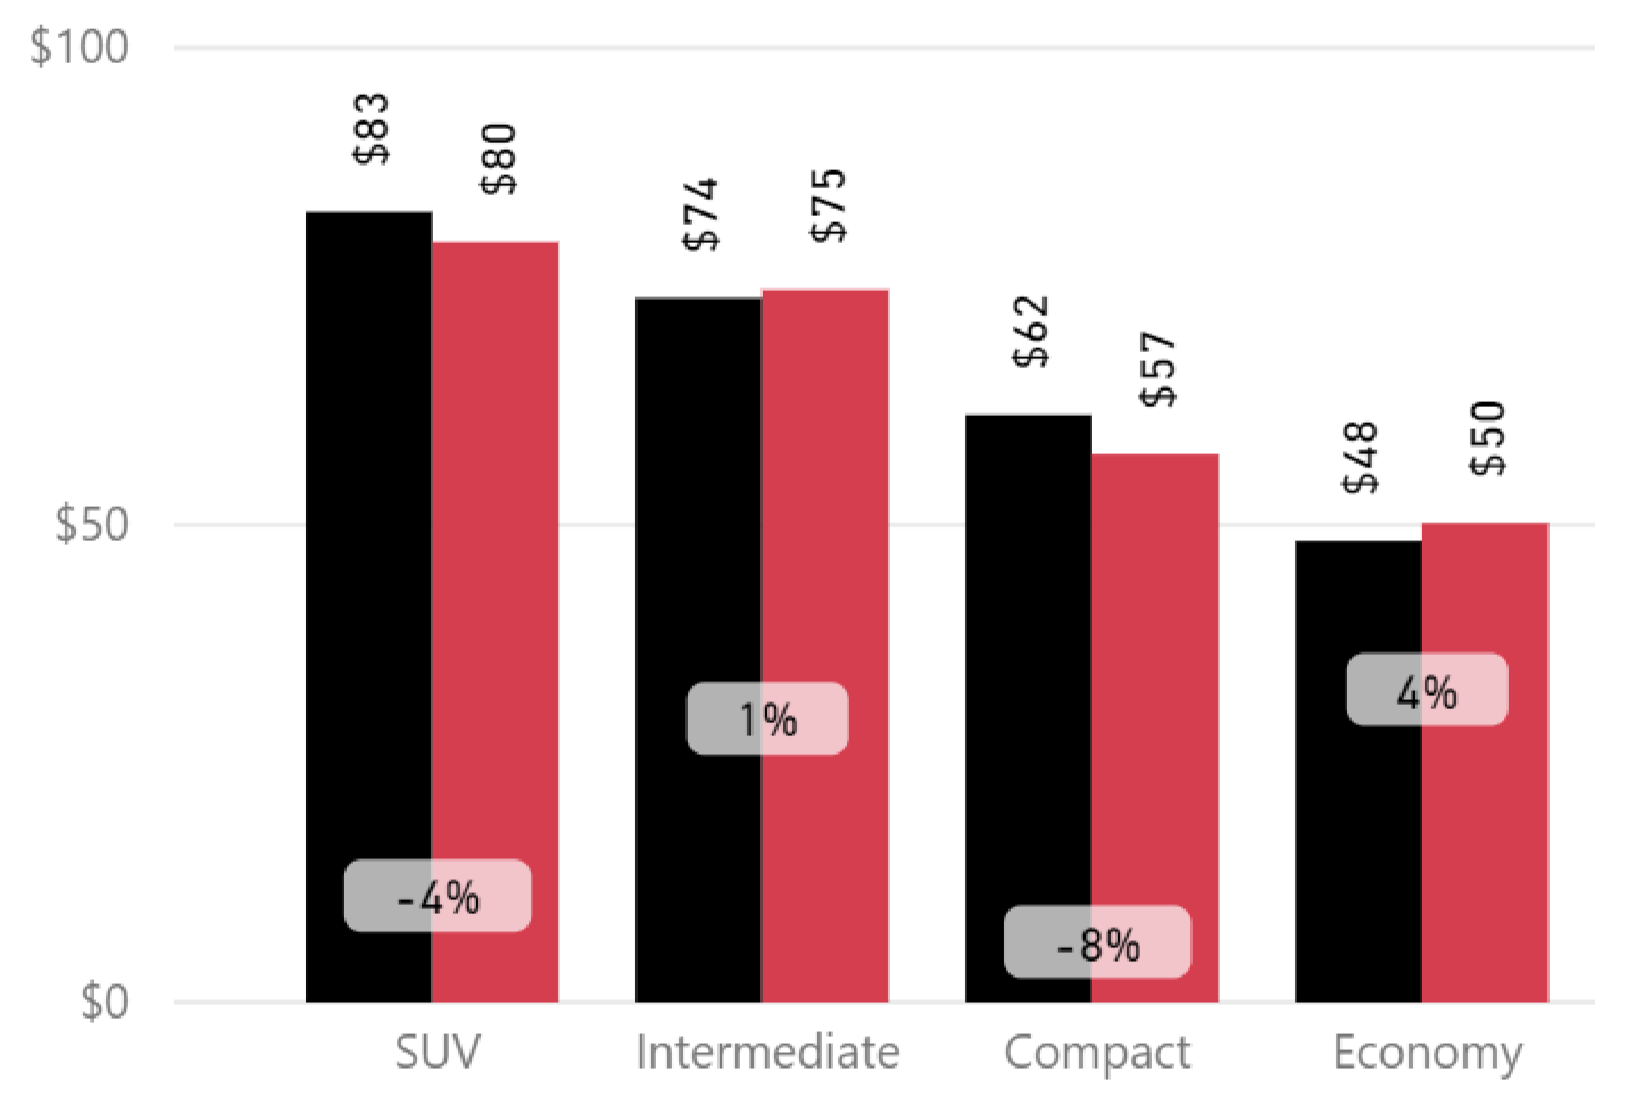
Fig. 10

Queenstown Airport YoY Summary
Overall Queenstown Airport had a YoY average rate decrease of -1%.
The rentalcars.com sales channel showed an average rate increase of +6%, while Airport Rentals and the direct channels showed decreases of between -16% and -4% respectively (Fig. 11).
The average rate for a 3-day duration decreased -2%, while the average rate for longer 7-day and 14-day flat and -4% respectively (Fig. 12).
The average rate for SUV’s was down -2%, with all other categories showing average rates of between +8% and -4% (Fig. 13).
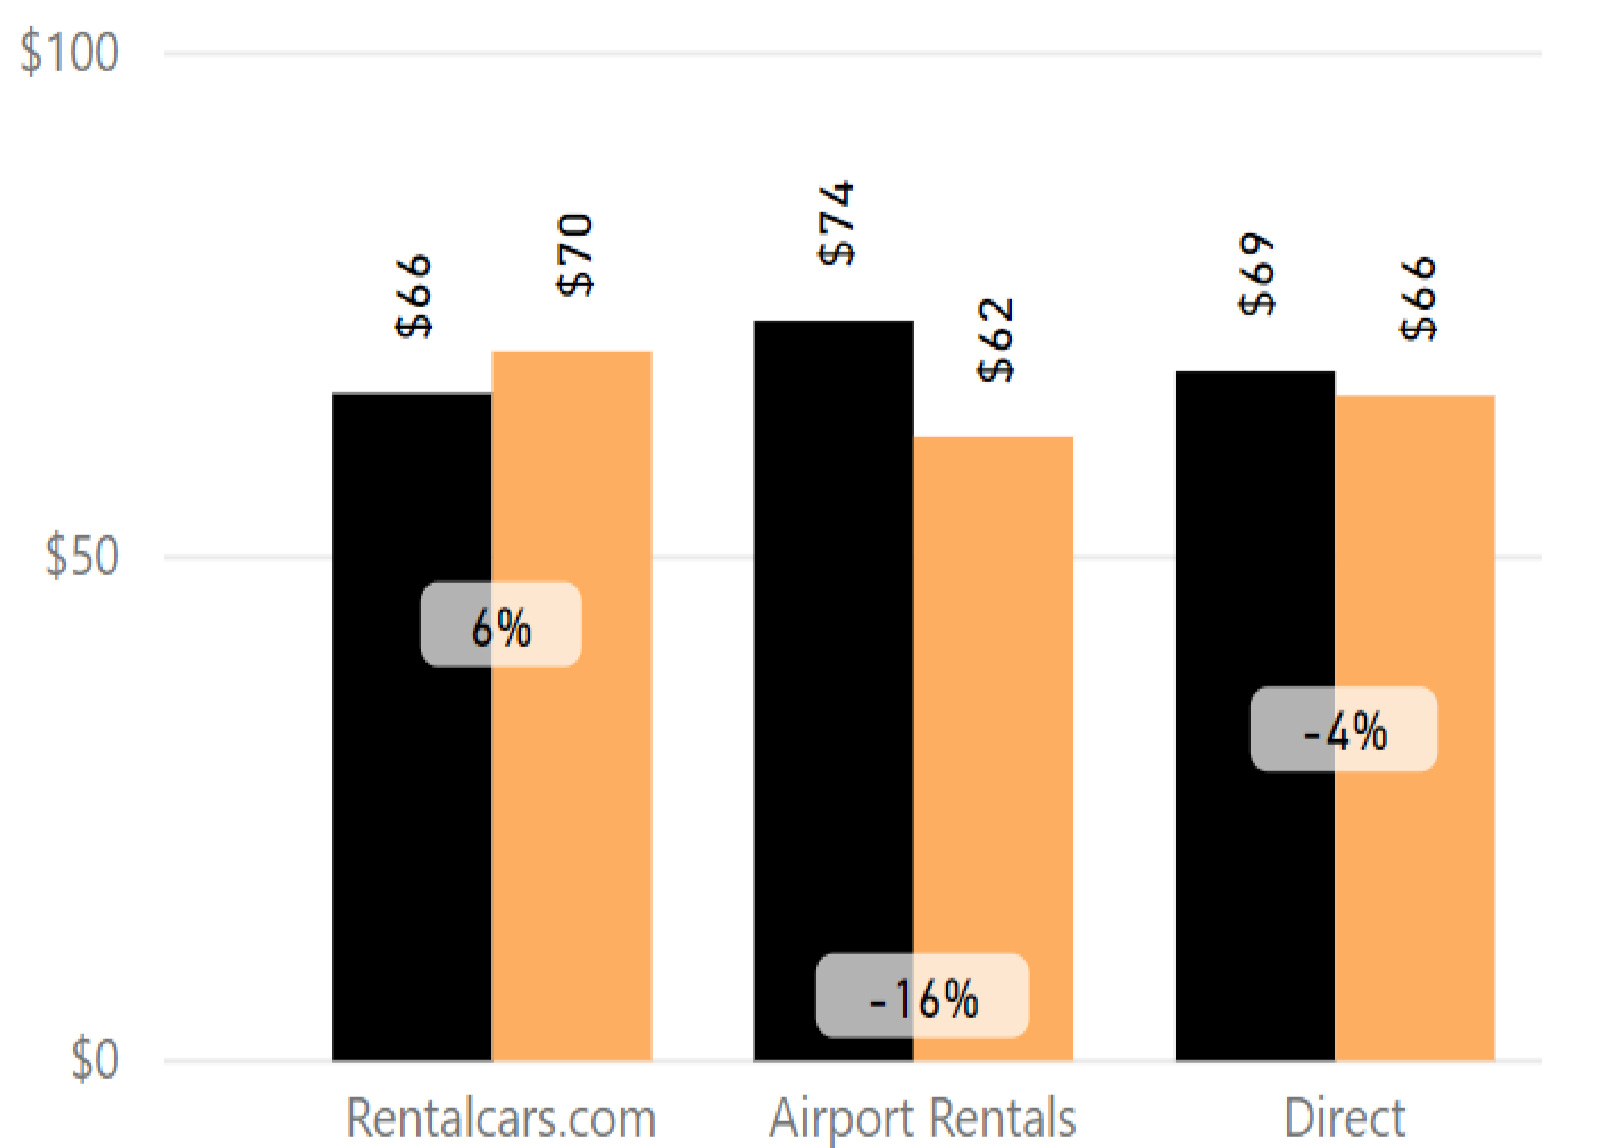
Fig. 11
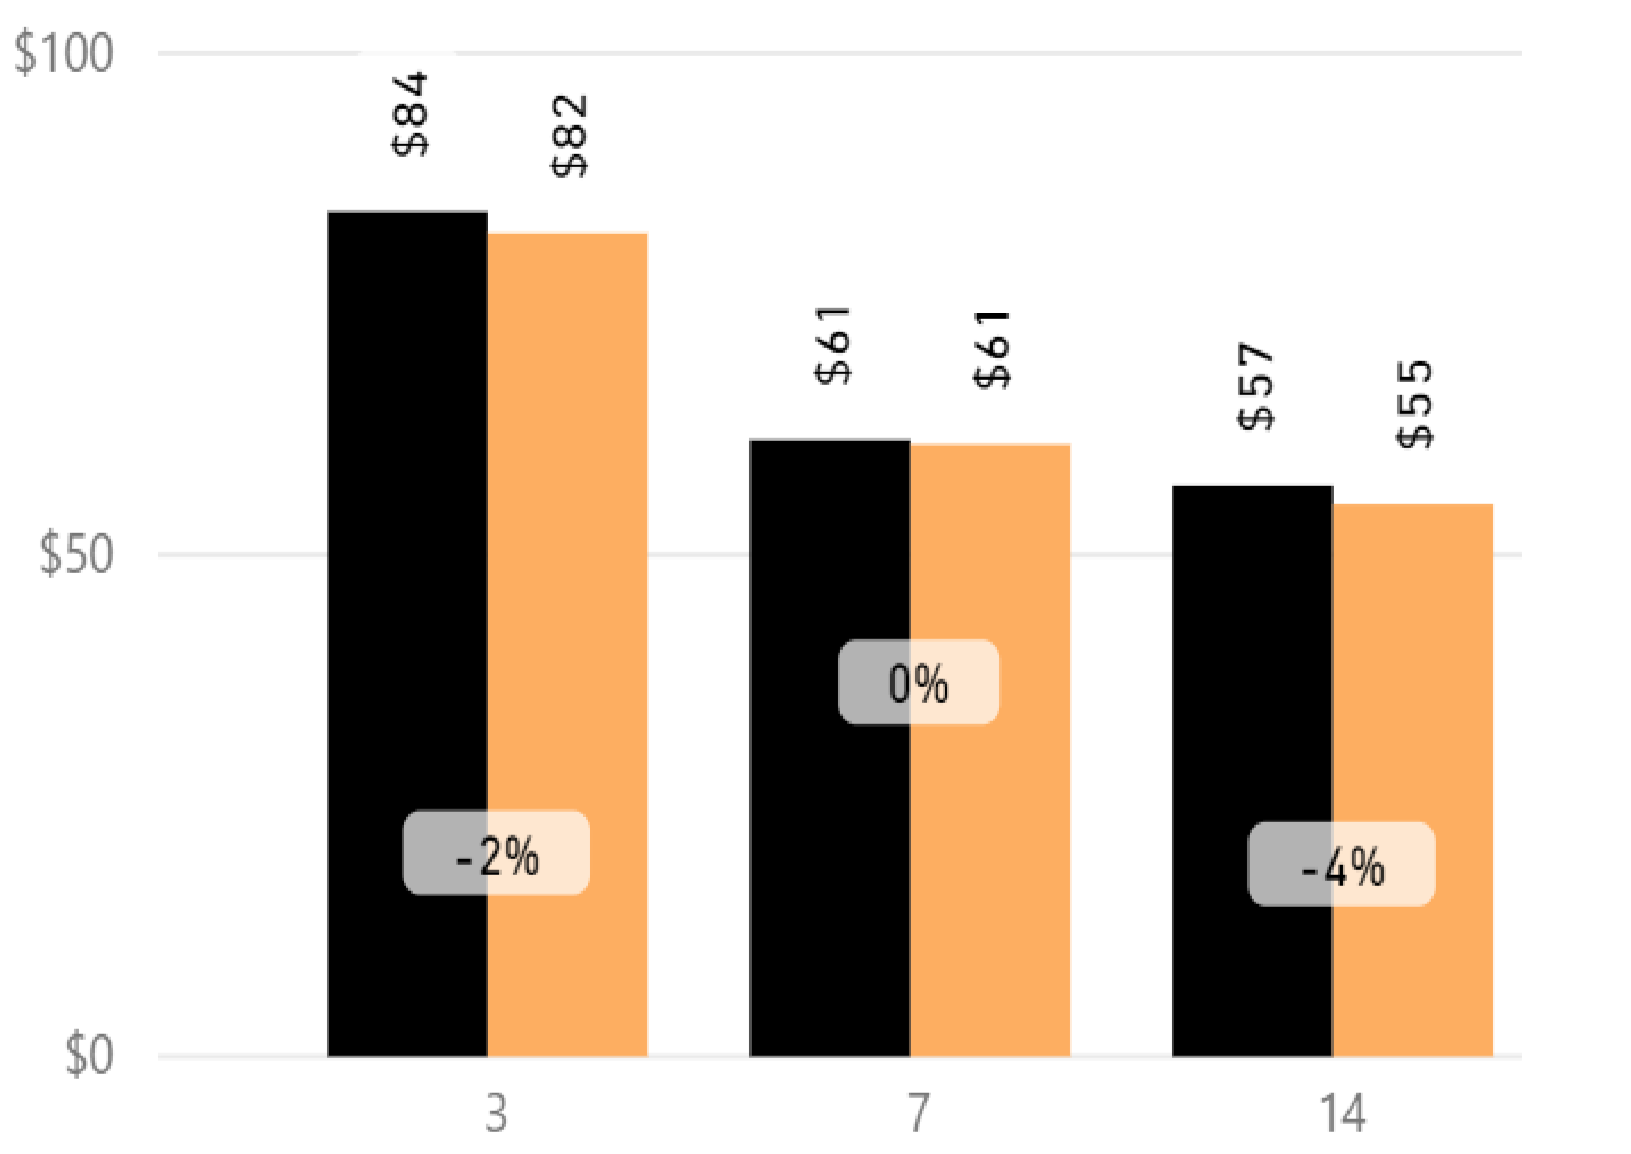
Fig. 12
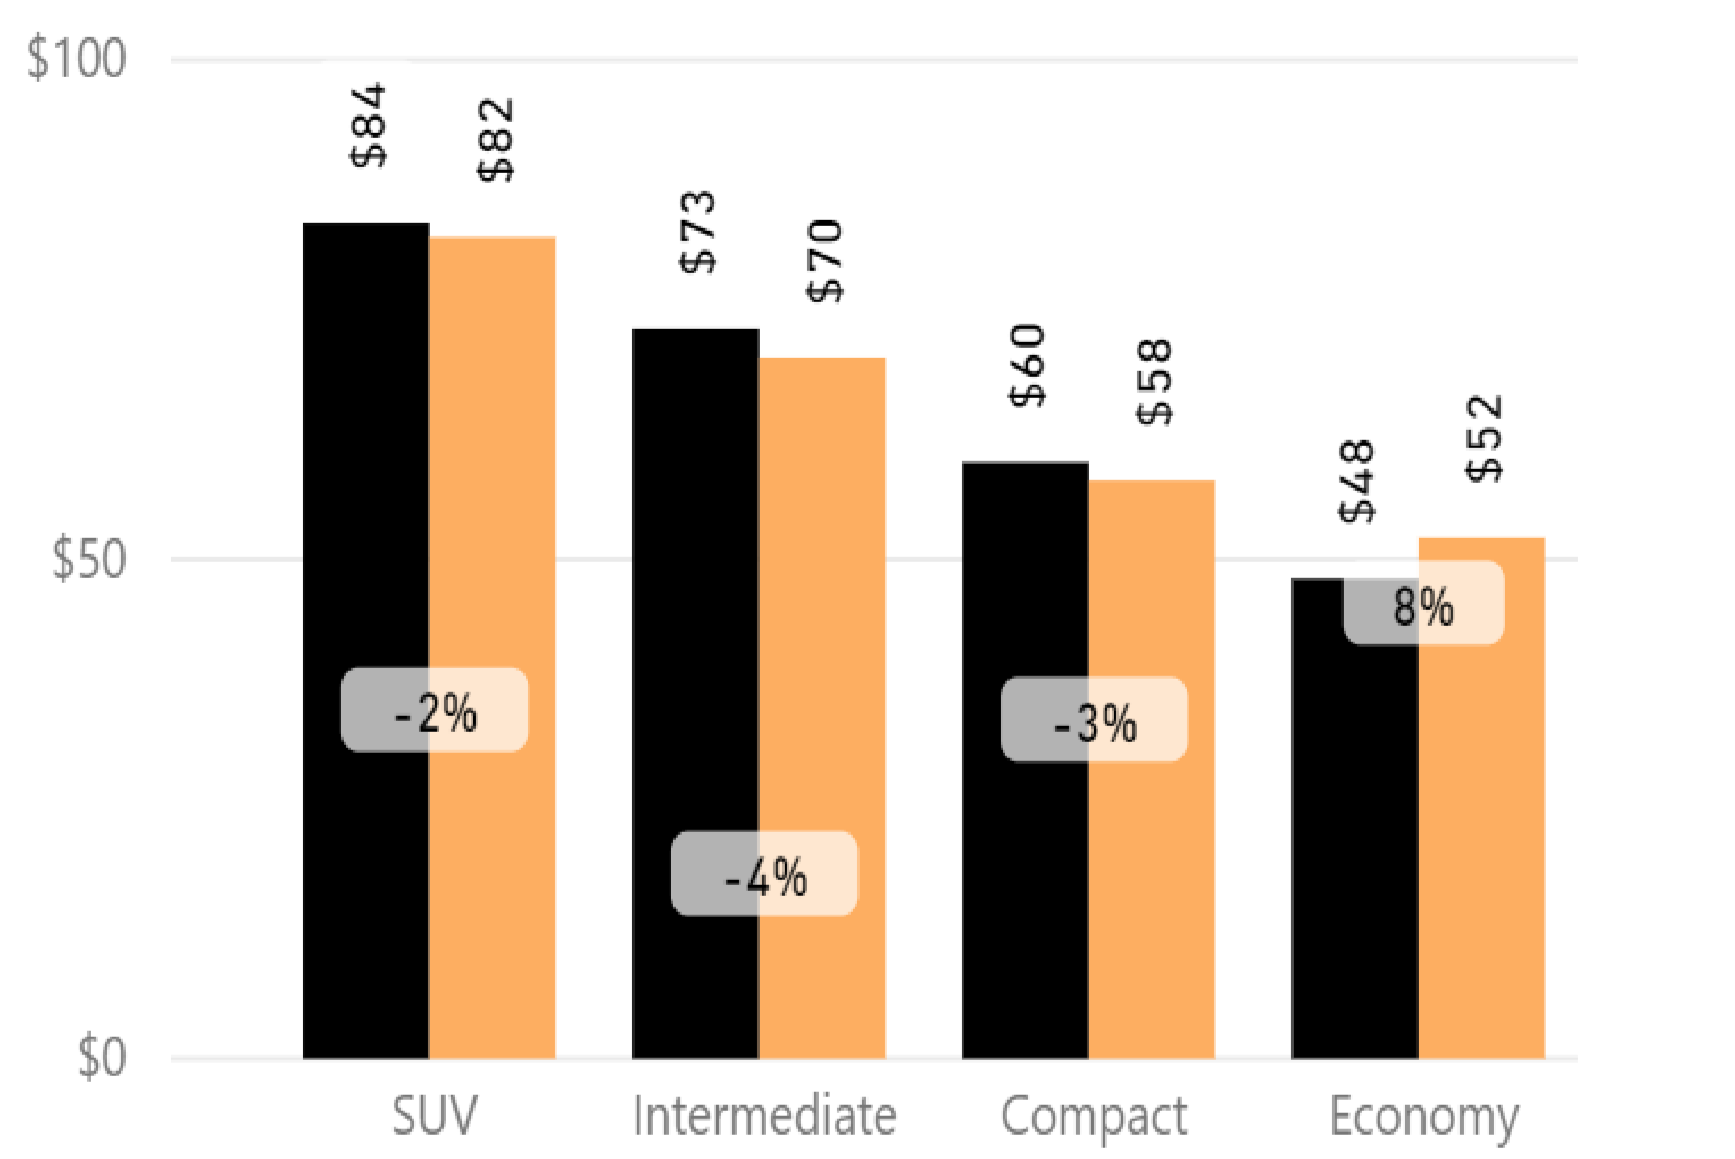
Fig. 13

SECTION 2
YEAR TO DATE (YTD) ANALYSIS
FROM JULY TO OCTOBER 2019
Year to Date (YTD) Analysis: July to October 2019
- Average rates were consistent in September and October 2019 (Fig.14)
- As is the trend in October 2019, average rates flatted or declined, with the average rate for Auckland Airport dropping -10% YoY
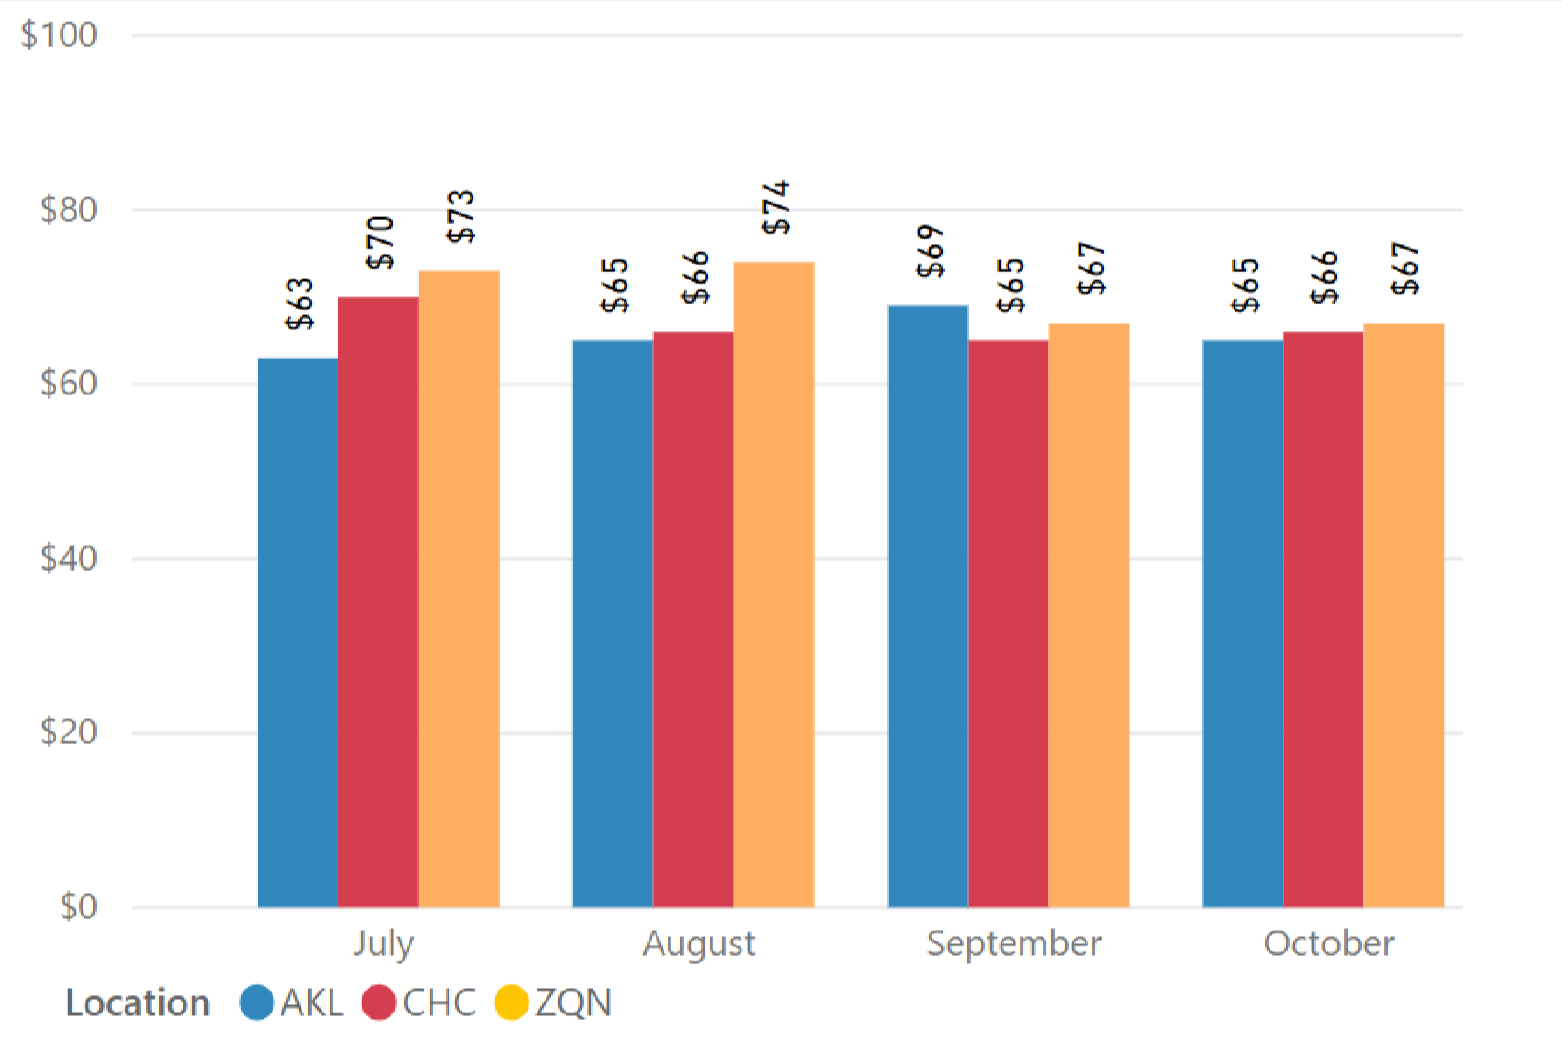
Fig. 14
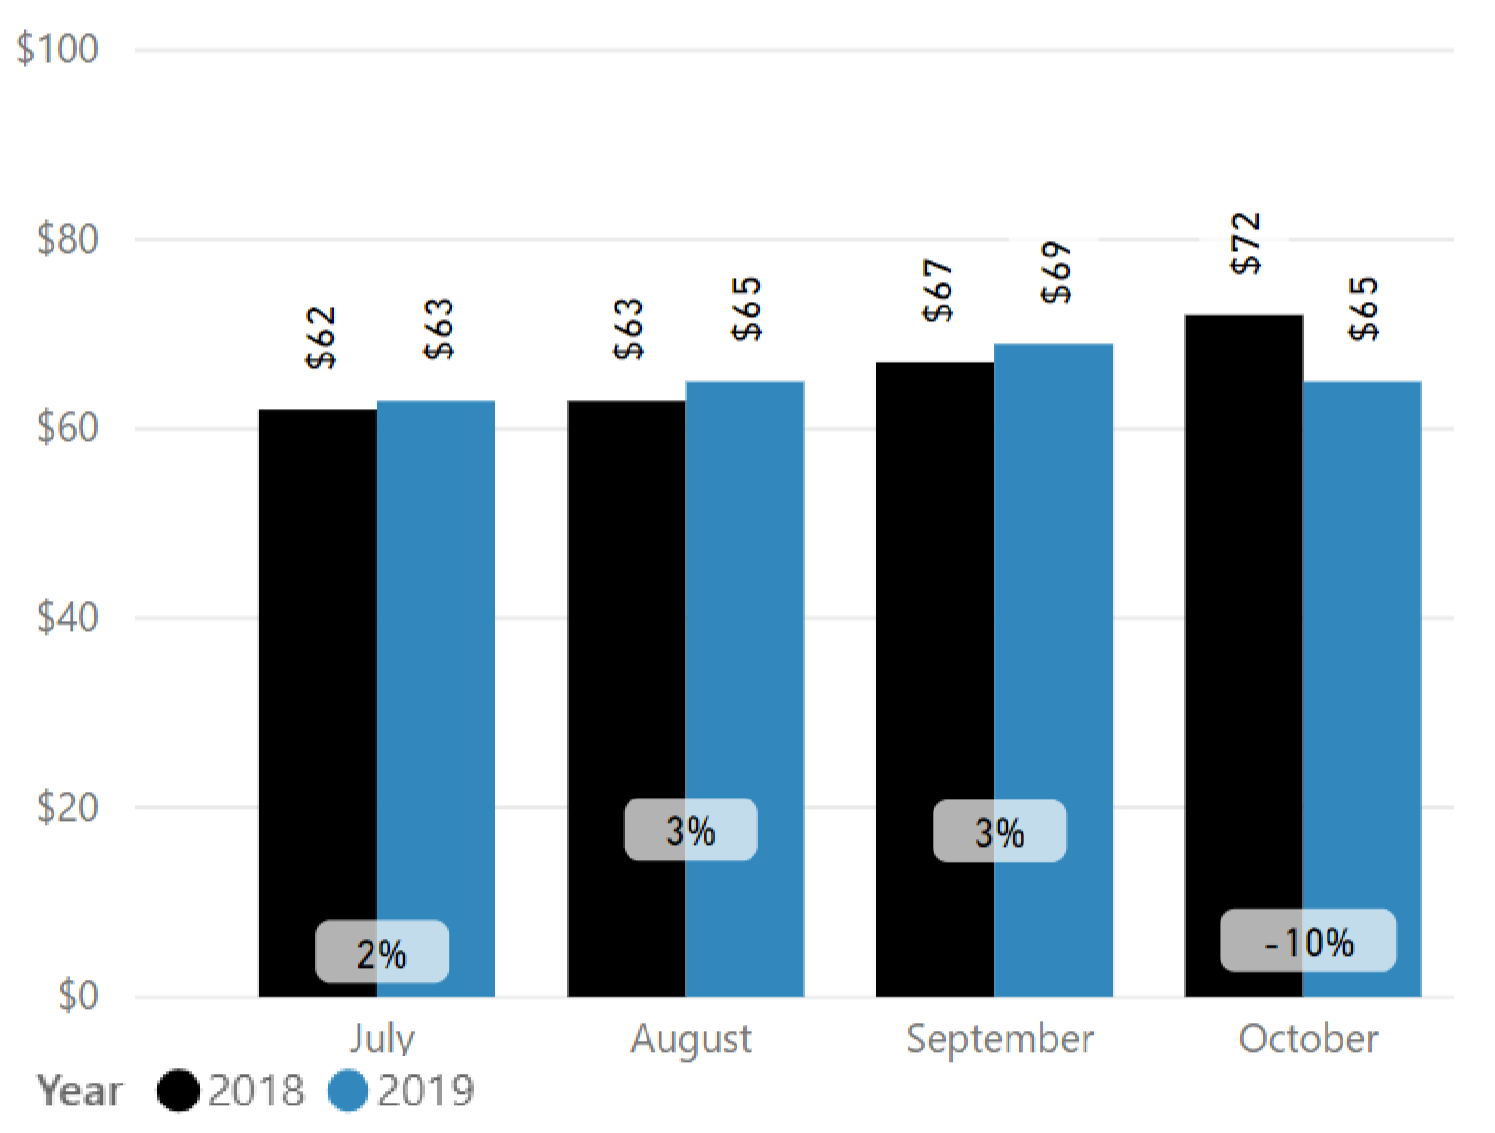
Fig. 15
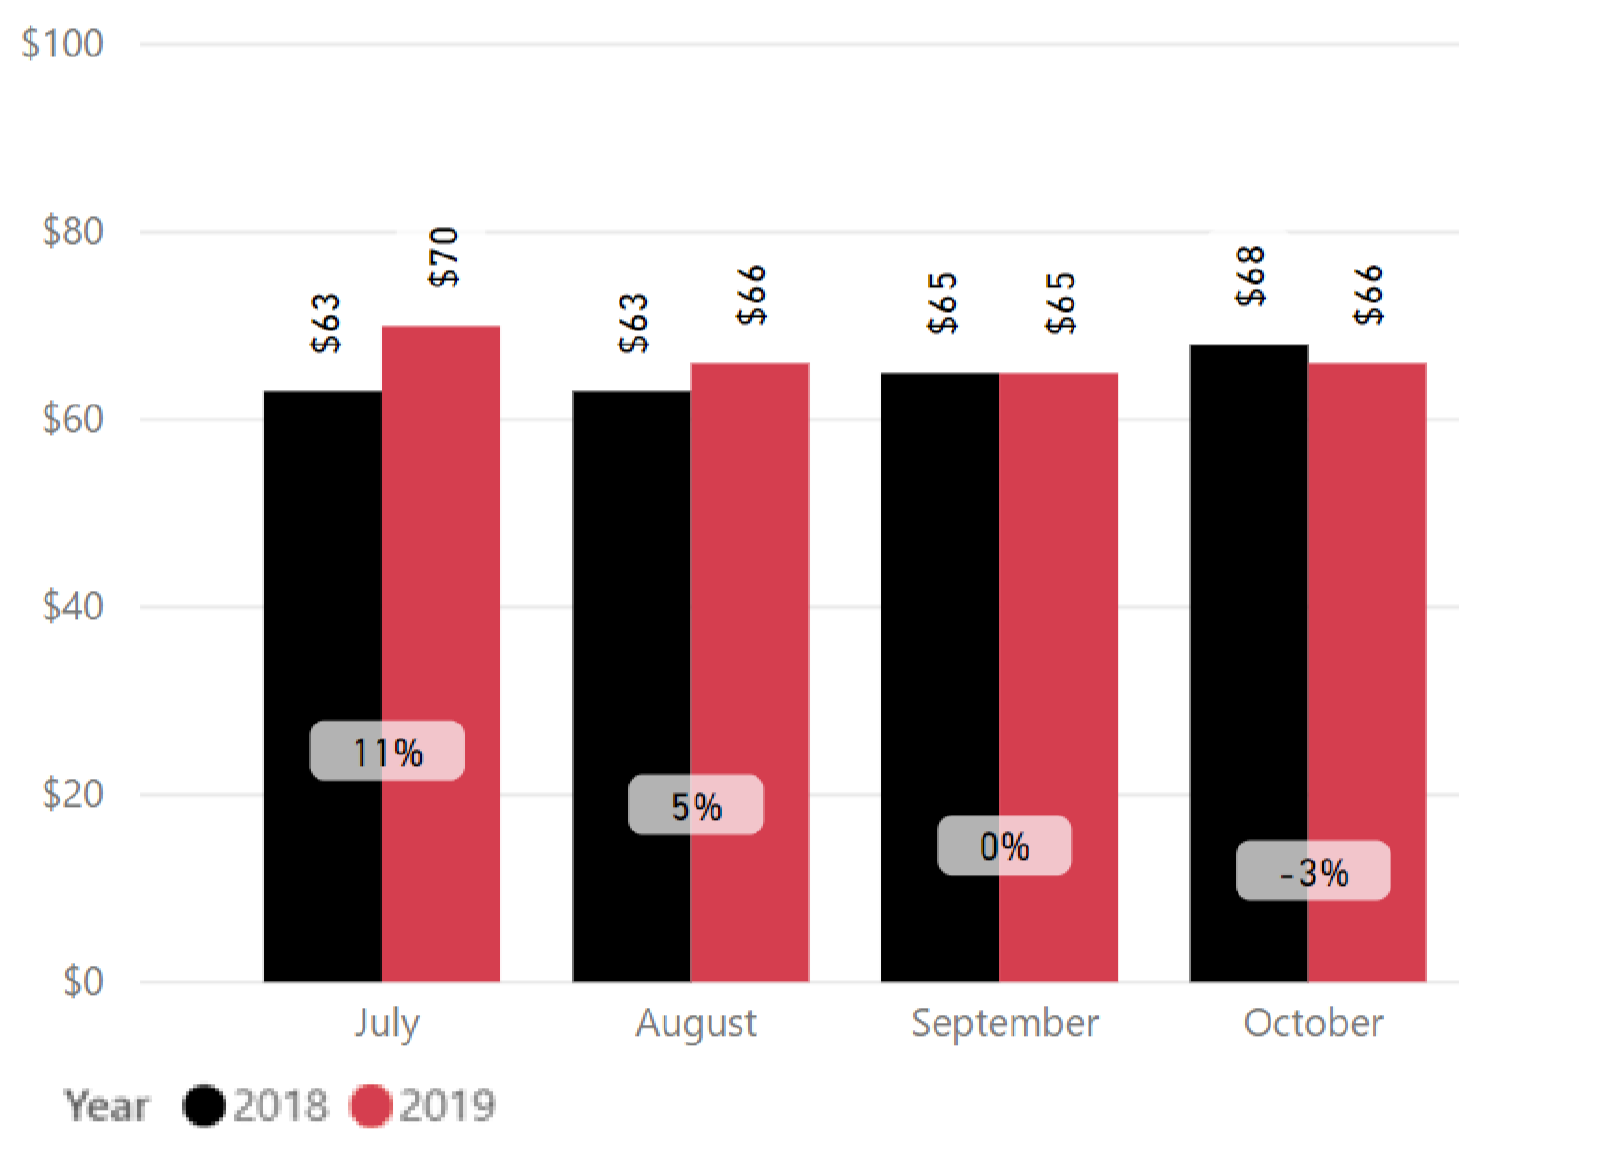
Fig. 16
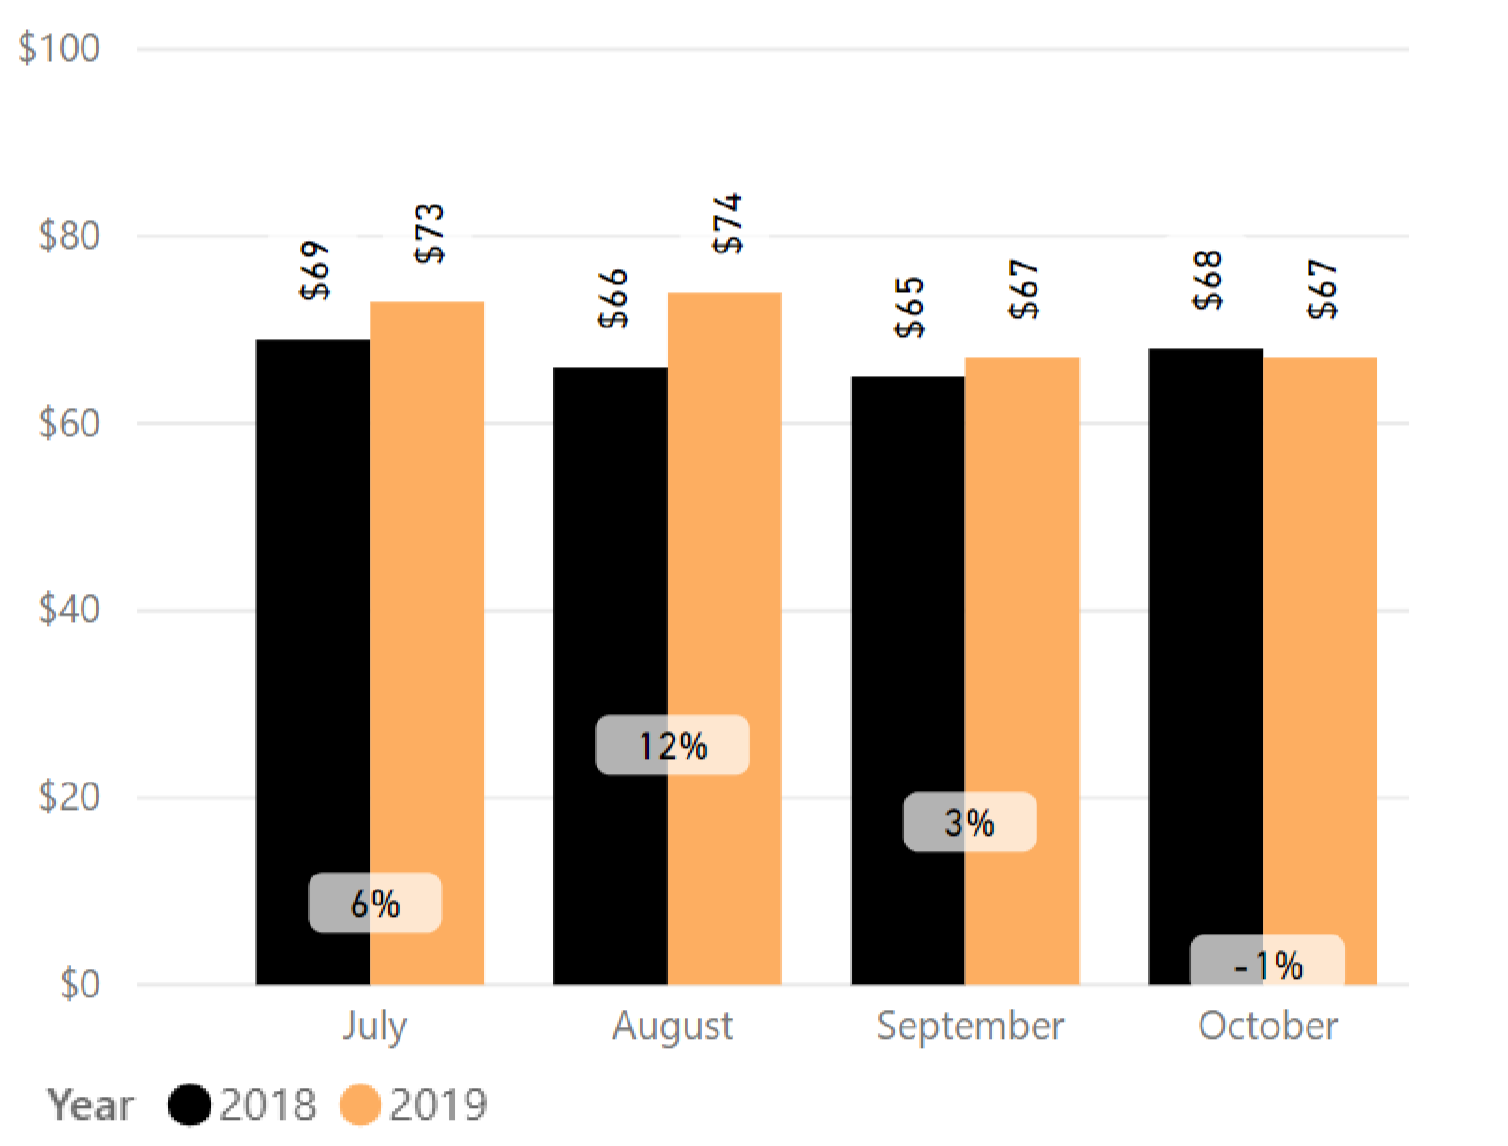
Fig. 17
SECTION 3
FORWARD MARKET ANALYSIS
FROM NOVEMBER 2019 TO FEBRUARY 2020
Forward Market Analysis: November 2019 to February 2020
Overall average rates remain soft the coming month (Fig.18). The average rates begin to build from mid-December 2019, and are very strong over the Christmas/New Year season from 23rd December 2019 to 5th January 2020 (Fig.19 to Fig.21).
Market Insider Tip:
November 2019 is looking soft compared to last year.
As noted in previous reports, rates will require active management. Targeted campaigns, pricing specials and channel distribution strategies will also help move inventory.
However, fleet management should be paramount as you do not want to left under fleeted in key summer markets, mainly Auckland.
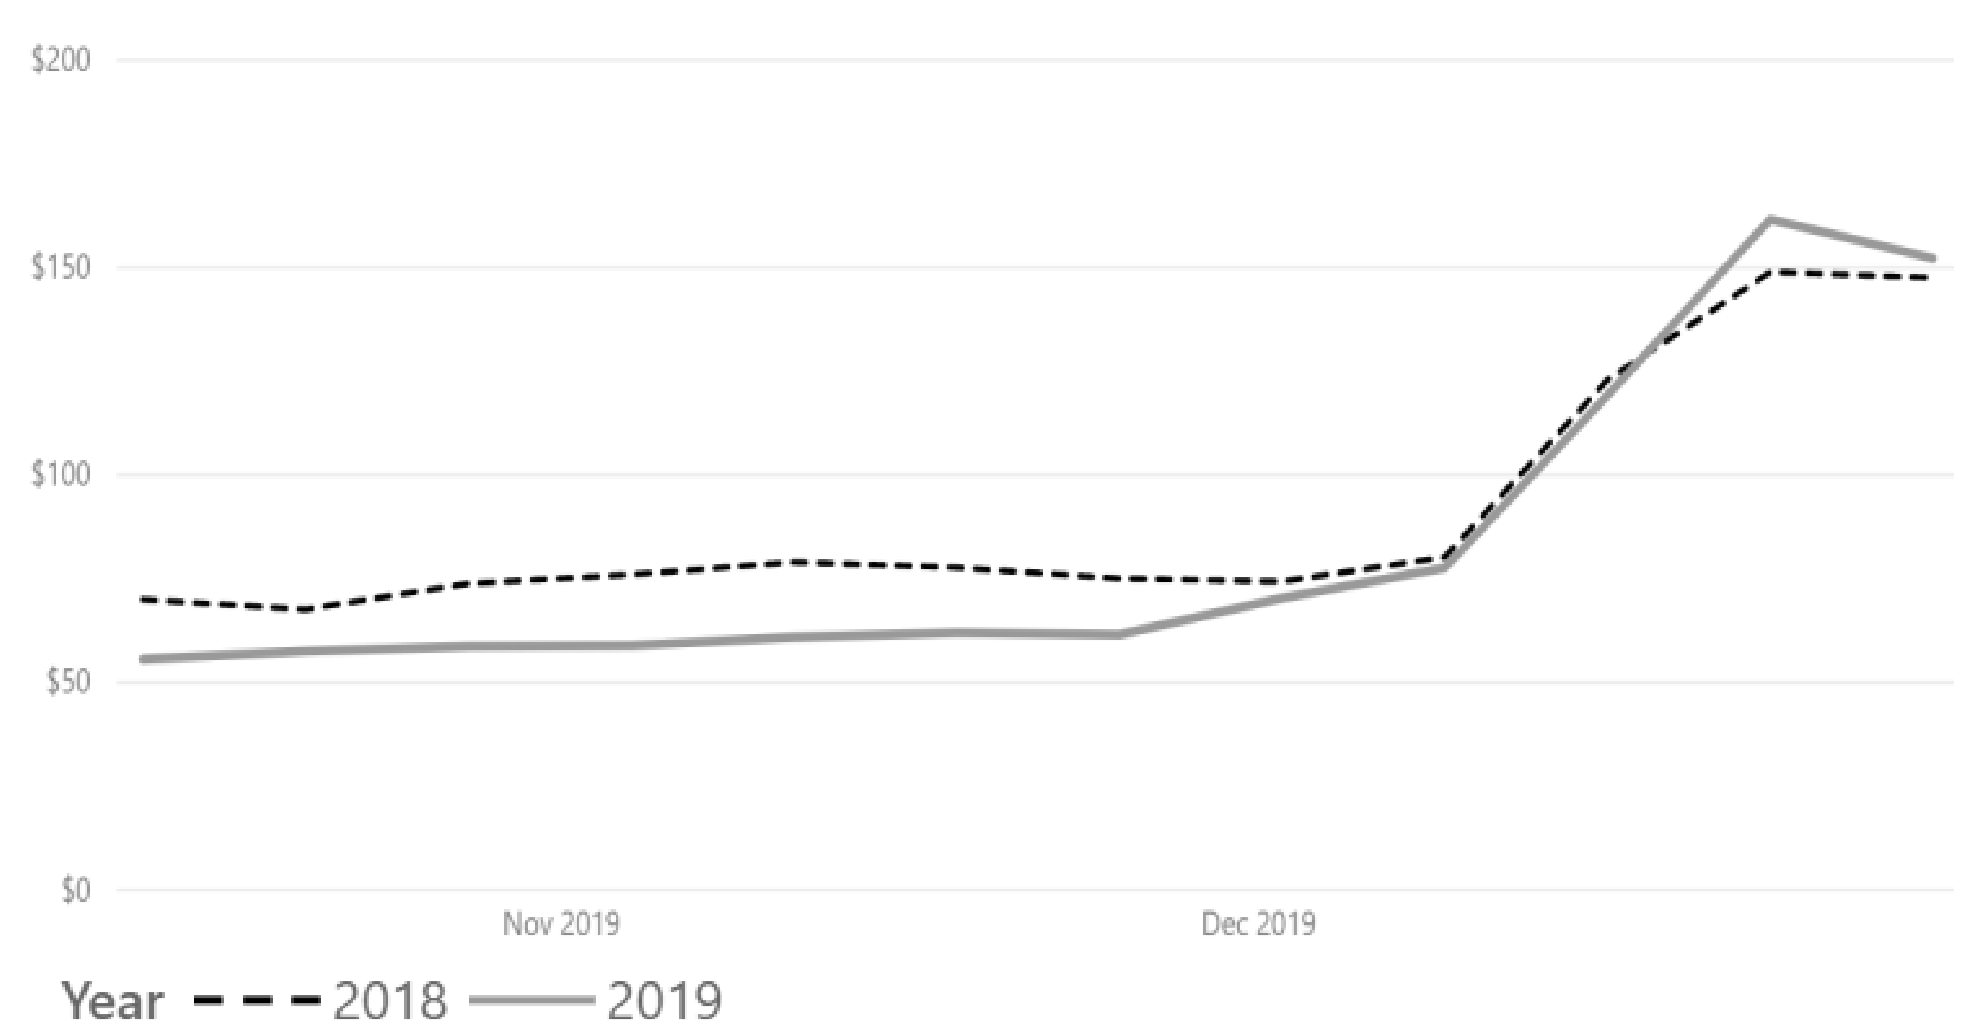
Fig. 18
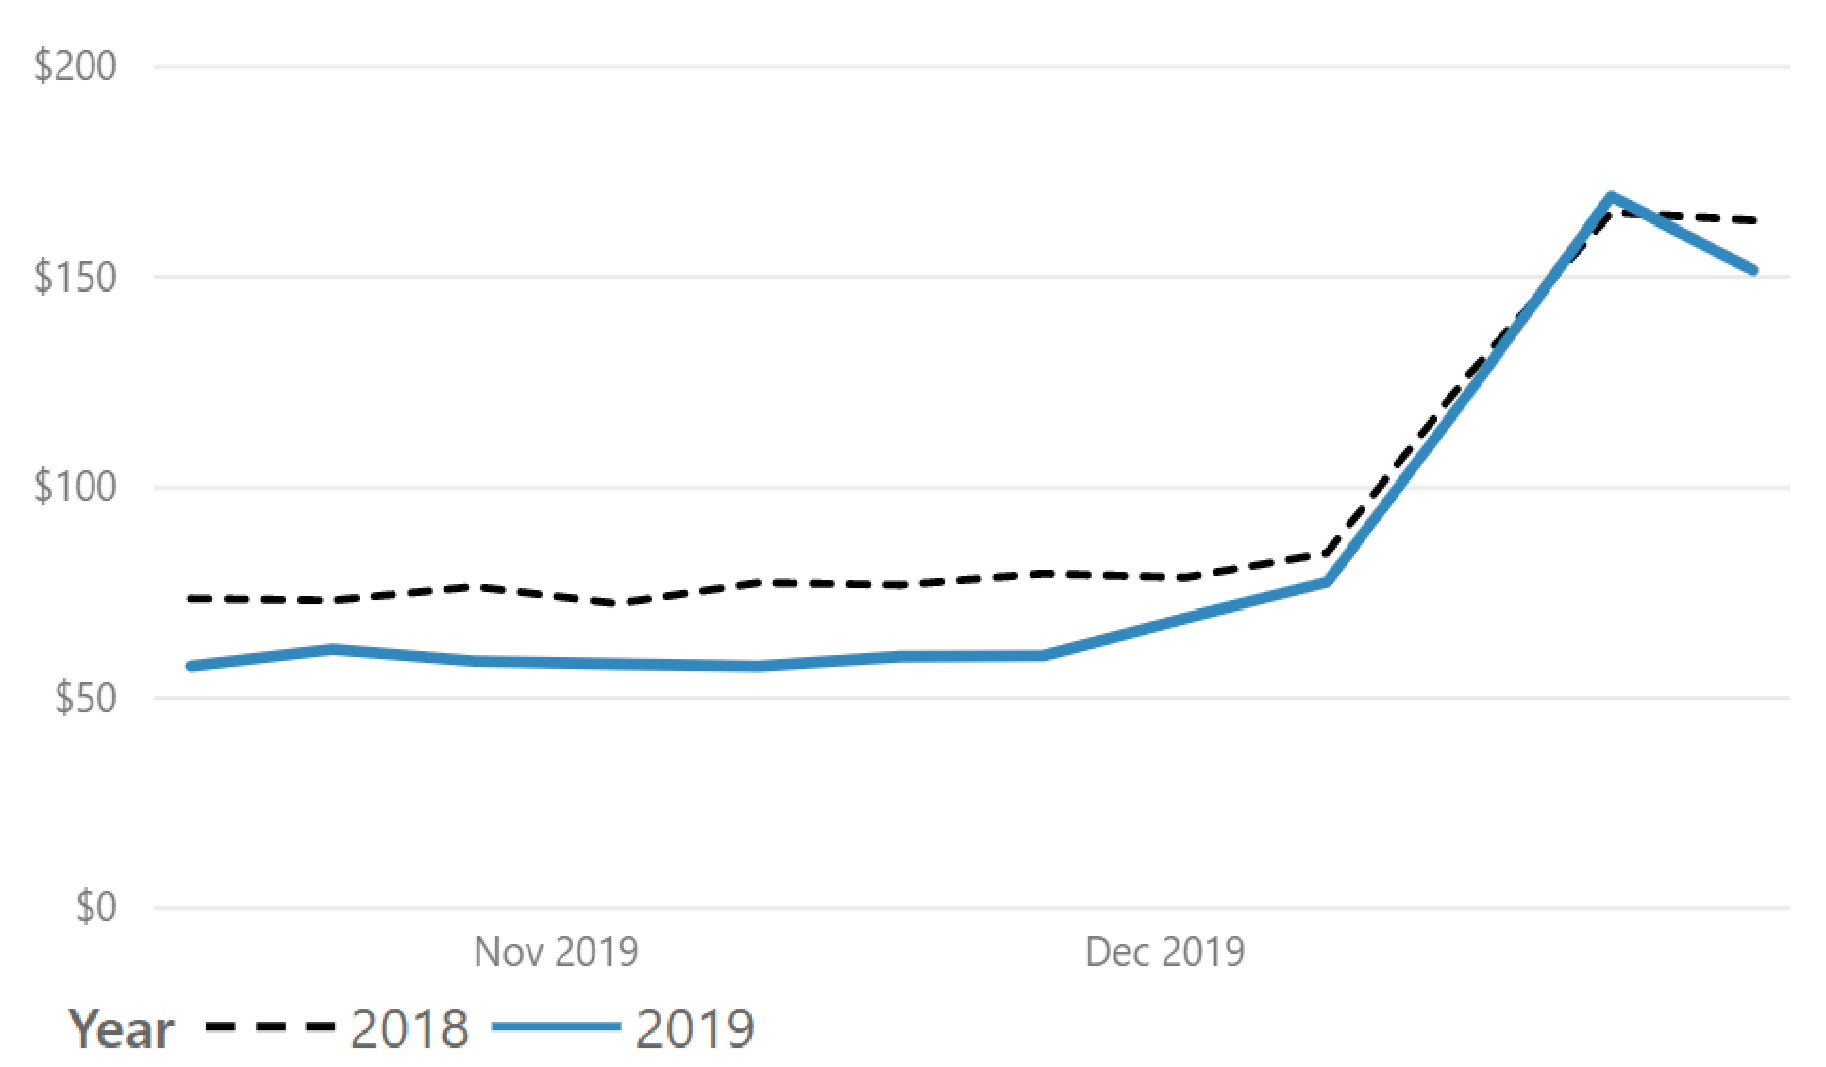
Fig. 19
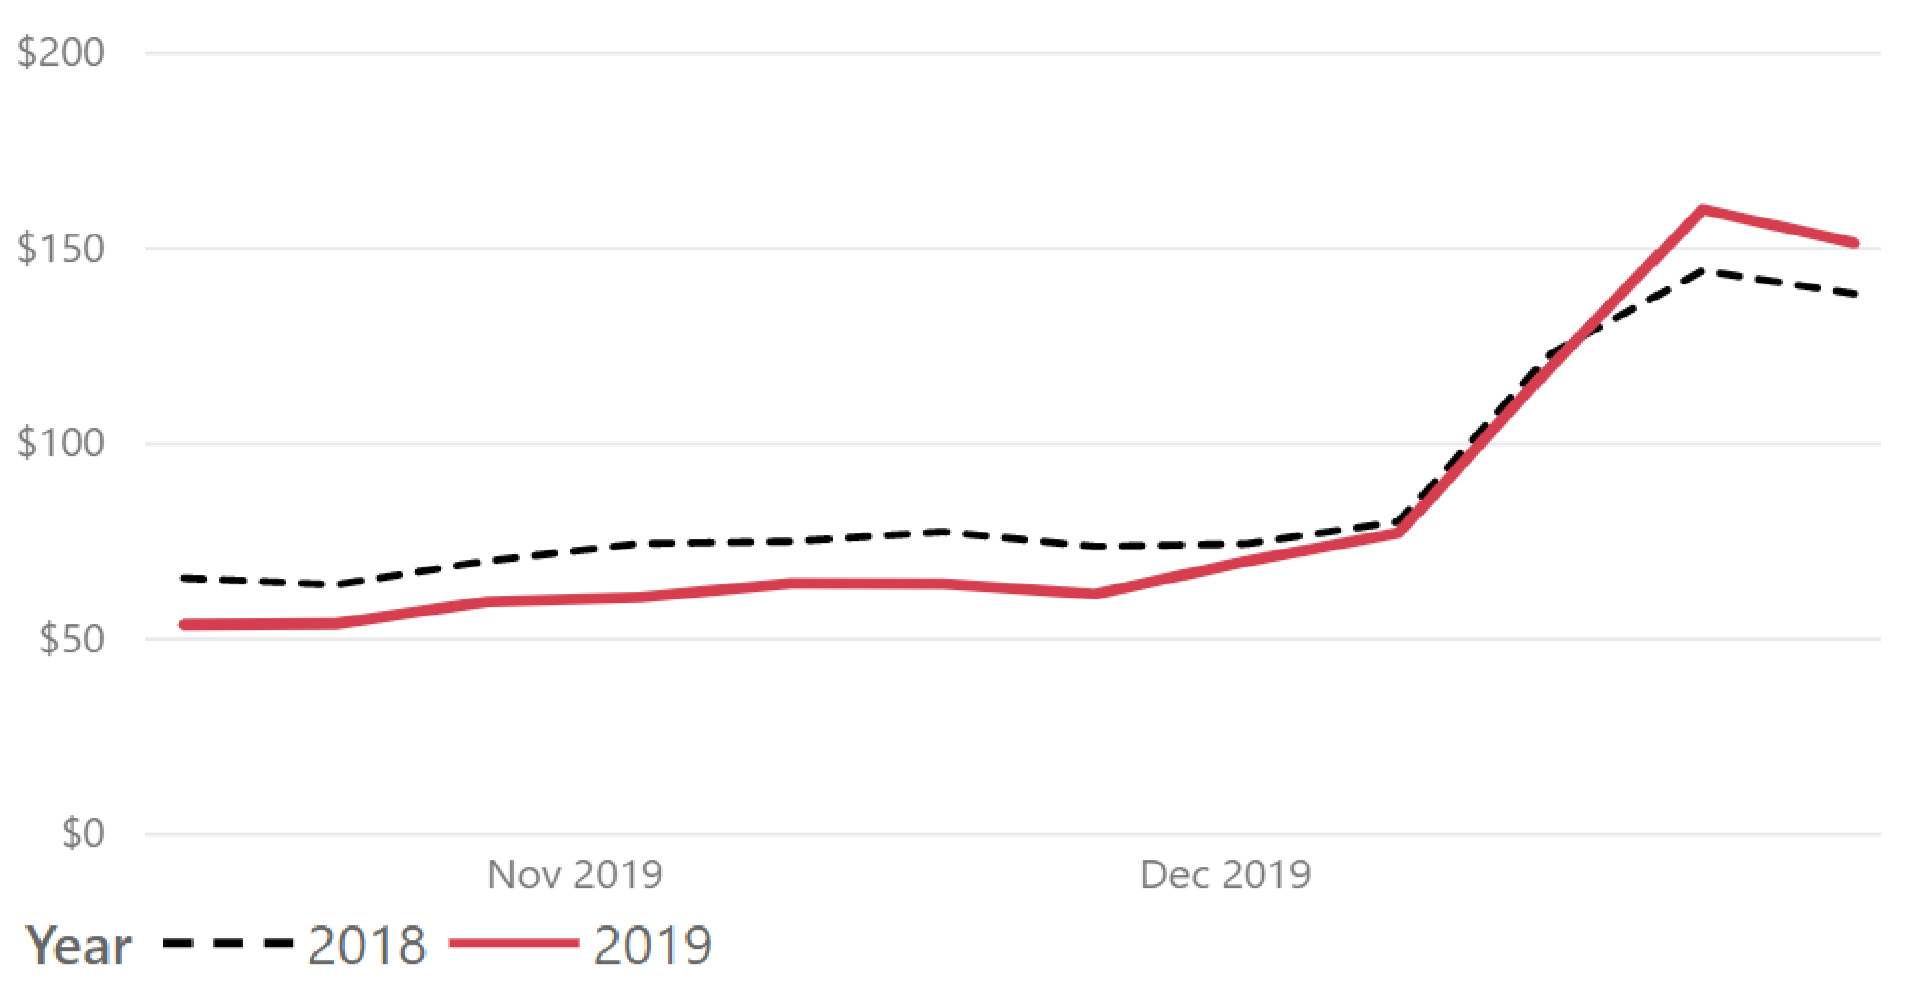
Fig. 20
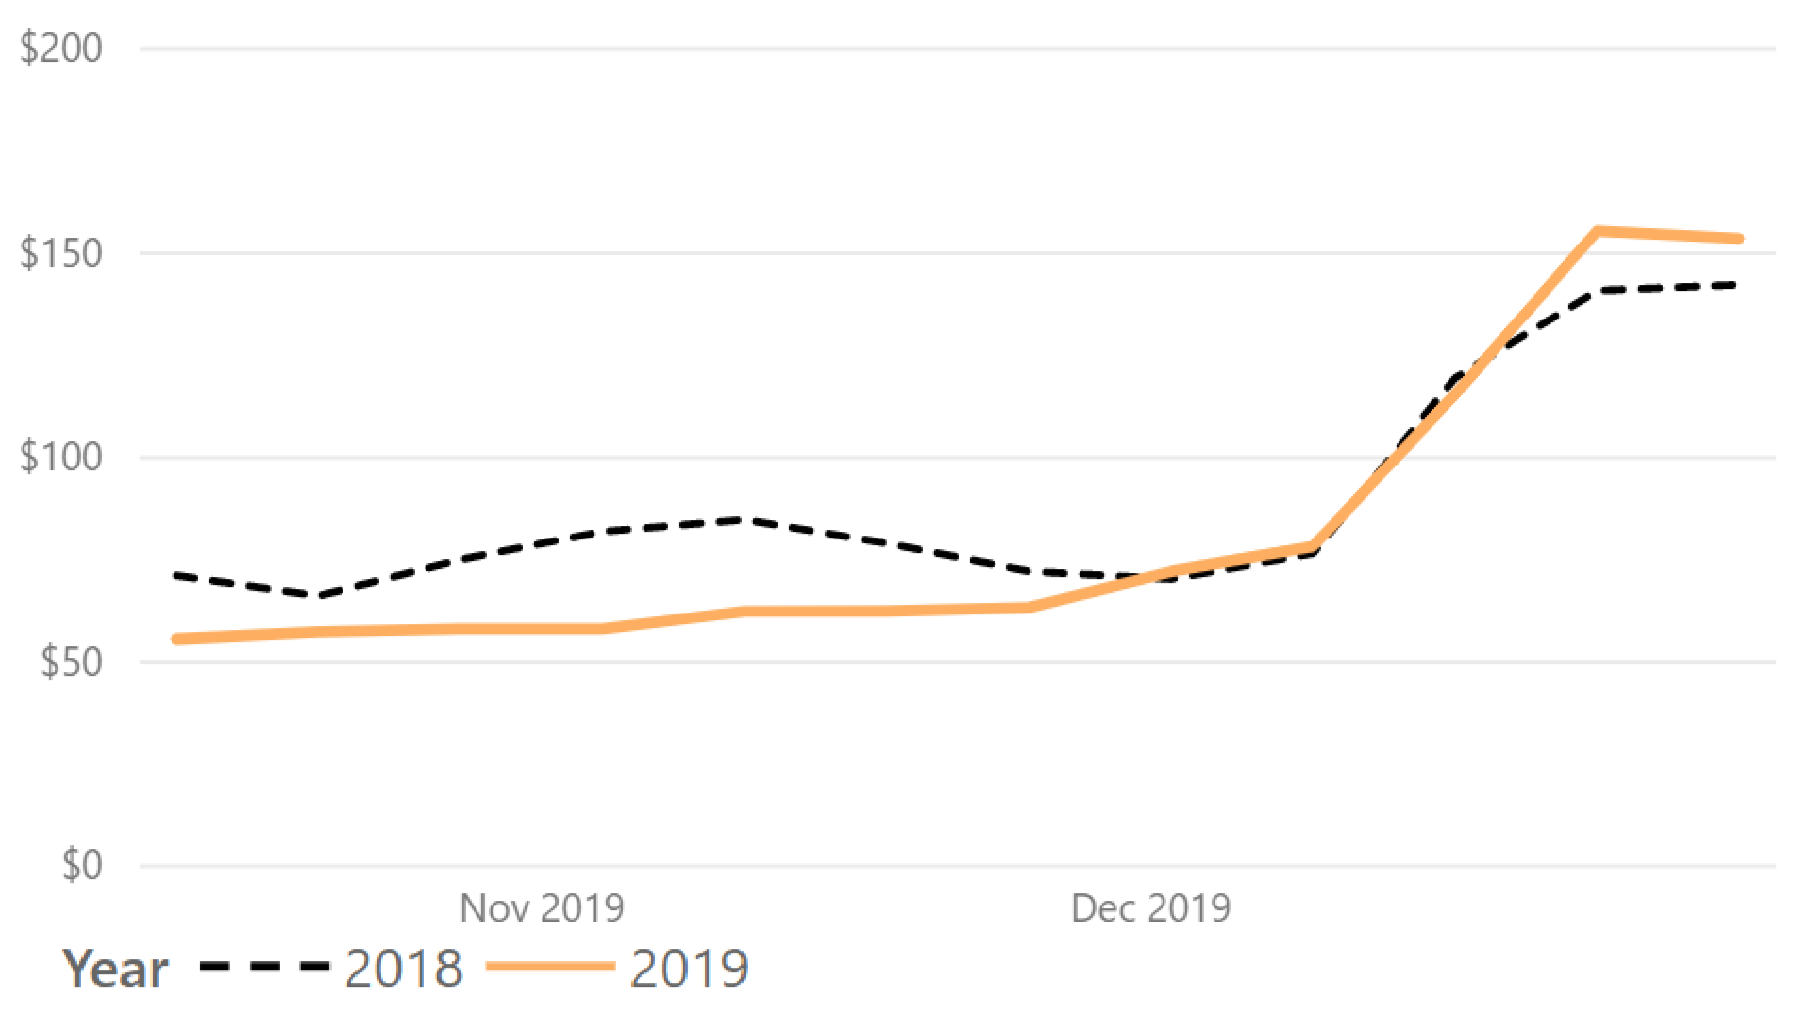
Fig. 21
Methodology & Disclaimer
Methodology:
- The data was derived from circa. four (4) million datapoints, and this size dataset was deemed large enough to draw reasonable conclusions
- Inconsistent outlying datapoints were removed
- The data collected is from 13 individual rental vehicle operators (a mix of independent, franchise, small, medium and large operators)
- The data collected from the 13 rental vehicle operators has been anonymised and aggregated, then displayed to provide a general reflection of the overall market
- The pickup days included in the data are Tuesdays and Fridays
Disclaimer: